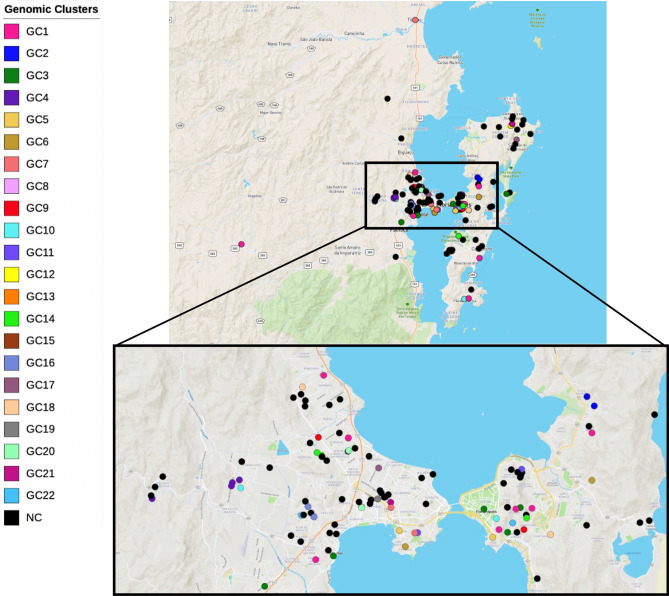
Figure 3.
Geographic distribution of 142 out of the 151 TB cases (excluding 9 homeless) included in the study for which address of residence was available. These cases were geographically mapped according to the respective address of residence and are shown in the map colored according to the respective isolate’s genomic cluster. The spatial distribution of these cases and correlation with the genomic cluster shows an extensive geographical spread of the larger clusters (n ≥ 3) except for GC2, GC4 and GC10. The map was created using the online microreact tool,
available at https://microreact.org/project/hrdK7GcztX8M2ZXEXjc579.

