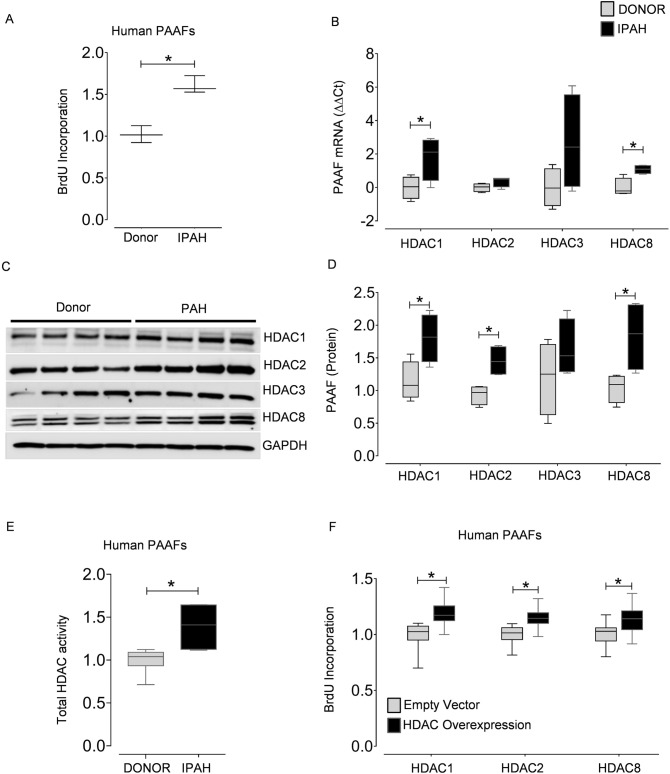
Figure 3.
Class I HDAC isoforms are overexpressed in PAH and are associated with adventitial fibroblast proliferation. Cell proliferation was assessed by BrdU incorporation in (A) donor- and IPAH-PAAFs (n = 3) cultured ex vivo. Data was normalized to respective donors. (B) qPCR analysis of HDACs was performed on the RNA isolated from the PAAFs harvested from healthy donors (n = 4) and PAH (n = 4) patients. ∆Ct values were normalized to β-2 microglobulin (β2M) and further normalized (∆∆Ct) to donor controls. (C) Western blots were performed on lysates extracted from human PAAFs of healthy donors (n = 4) and PAH (n = 4) patients. (D) Blots were quantified by densitometry and are represented as box plots after normalization to internal loading control. (E) HDAC activity (OD/min/mg) was measured in PAAFs harvested from healthy donors (n = 3) and PAH (n = 3) patients using colorimetric assay kit (Epigenase HDAC Activity/Inhibition Assay Kit, Epigentek). (F) Overexpression of HDACs was achieved by transient transfection of donor-PAAFs (n = 3) with validated HDAC1, HDAC2, HDAC8 plasmids, and their functional effects on proliferation was assessed by BrdU incorporation, 48 hours (h) post-transfection. Empty vector plasmid was used as negative control. Data was normalized to untransfected cells. In all plots, significant differences between corresponding comparisons are indicated as *p < 0.05, Student's t-test.

