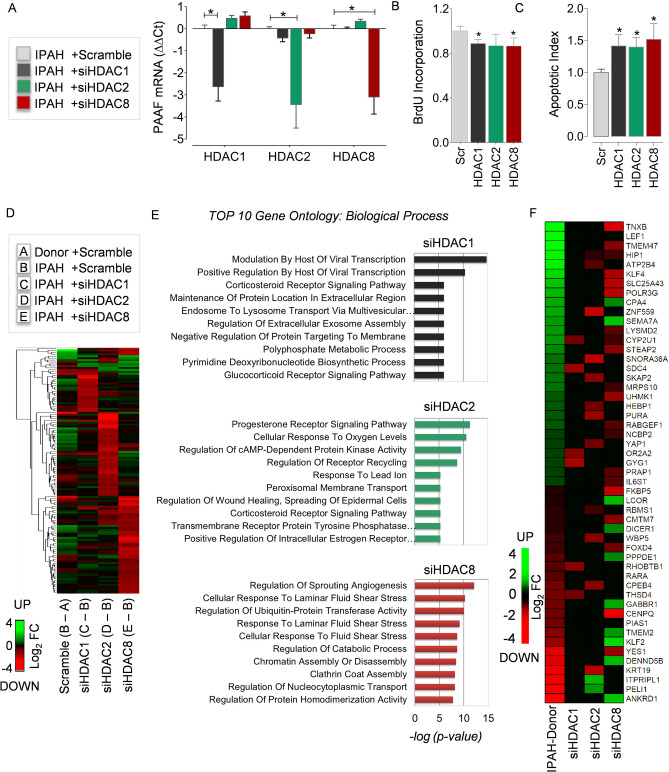
Figure 4.
Transcriptome and pathways regulated by HDAC isoforms in PAH. RNA-interference was achieved by transient transfection of IPAH-PAAFs cultured ex vivo with validated HDAC1, HDAC2 and HDAC8 siRNAs. (A) qPCR analysis was performed on the RNA isolated from IPAH-PAAFs (n = 3), 24 h post-transfection. ∆Ct values were calculated using β2M as reference and further normalized (∆∆Ct) to the respective solvent concentrations (DMSO or water). (B) Functional effects of RNA-interference on fetal calf serum (FCS) induced IPAH-PAAF proliferation was assessed by BrdU incorporation, 48 h post-transfection. Similarly, (C) functional effects of RNA-interference on serum starvation (0.1% FCS) induced apoptosis in IPAH-PAAFs was assessed by Cell Death Detection ELISAPLUS, 48 h post-transfection. Data was normalized to untransfected cells and visualized (IPAH; n = 3; *p < 0.05 versus scrambled siRNA, Student's t-test). (D) Transcriptomic alterations between IPAH and donor-PAAFs (B-A) and the genome-wide transcriptional targets of individual HDAC isoforms was profiled using microarray-based expression analysis following RNA-interference in IPAH-PAAFs, along with scrambled siRNA as a negative control. Heatmap shows hierarchical clustering of all genes selected for at least one of the comparisons C-B, D-B, and E-B (log2FC ≤ − 1 or log2FC ≥ + 1, FDR < 0.05) (Supplementary Table 3). The colors indicate log2 fold-differences between the compared groups. Green and red indicate higher and lower expression, respectively, in the group that is given first, compared to the group given second. (E) Gene ontology (GO) enrichment analysis was performed to identify GO terms associated with biological process (BP, − log2(p-value) < 0.05) and top 10 GO terms for each comparison (C-B, D-B, and E-B) were displayed as bar charts (Supplementary Table 4). (F) Differentially expressed protein coding genes that are differentially expressed in comparison (B-A) and in at least one of the siRNA knockdown comparisons (C-B, D-B, E-B) were enlisted and displayed as a heatmap (Supplementary Table 3). FC Fold change, FDR False discovery rate.

