Figure 7.
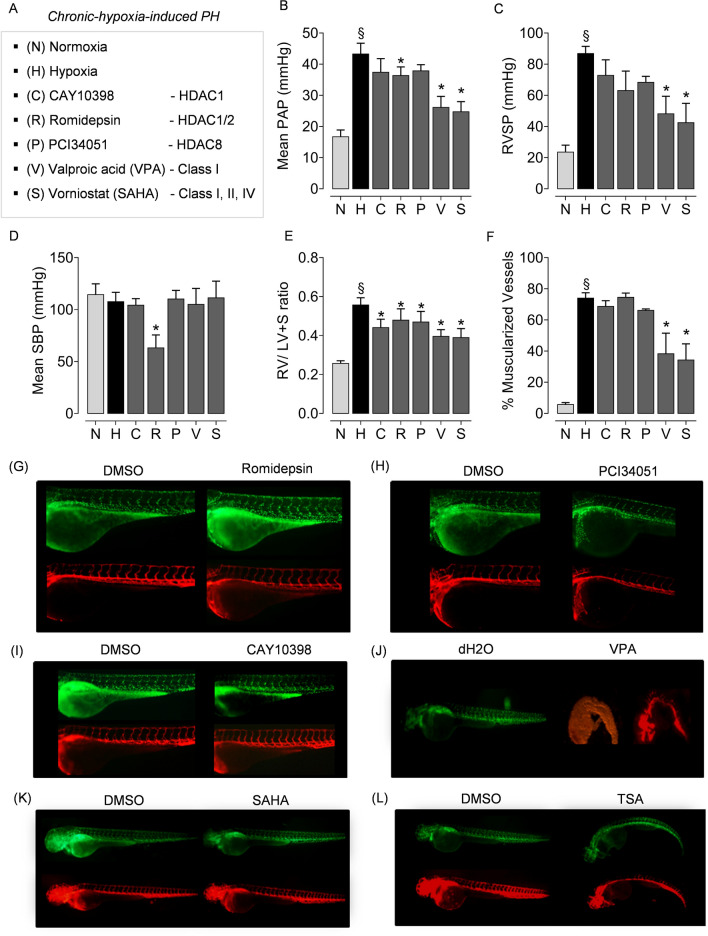
Evaluation of isoform-selective HDAC inhibitors in chronic hypoxia-induced PH and RV hypertrophy in vivo. (A) Rats were divided into seven groups and exposed to, (1) normoxia (N), (2) hypoxia (H) for 4 weeks, and hypoxia plus (3) CAY10398, (4) PCI34051 (P), (5) VPA (V), (6) SAHA (S) and (7) Romidepsin (R). Compounds were administered during the last 2 weeks of 4 week hypoxia exposure (n = 6 rats were assigned per group treated with isoform-selective inhibitors). At the end of experiment, haemodynamic parameters were measured and analysed in the animals that completed the treatment regimen. The parameters analysed were (B) mean pulmonary artery pressure (mPAP), (C) right ventricular systolic pressure (RVSP), (D) systolic blood pressure, (SBP), (E) right ventricular hypertrophy (RV/LV + septum), and (F) percentage of muscularised vessels. Data are represented as bar charts (n ≥ 3; *p < 0.05 versus hypoxia, §p < 0.05 for hypoxia versus normoxia, one-way ANOVA followed by Tukey's multiple comparisons test). To study the effect of HDAC inhibitors on angiogenesis in vivo, the zebrafish embryos were treated with different concentrations of isoform-selective HDAC inhibitors (G) Romidepsin (1 µM), (H) PCI34051 (100 µM), (I) CAY10398 (100 µM), (J) class-selective inhibitor VPA (10 mM), and pan-HDAC inhibitors such as (K) SAHA (100 µM), (L) TSA (1 µM) or their solvents (DMSO or dd.H2O) 19 hours post fertilization (hpf). HDAC inhibitors were administered to zebrafish embryos at 19 hpf. More than 25 embryos per group were screened for each inhibitor. The zebrafish line employed in this study was generated from Tg(fli1a:nEGFP)y7 (engineered to exhibits green fluorescence), and Tg(kdrl:HsHRAS-mCherry)s896 (engineered to exhibit red fluorescence) to monitor in vivo vascular network.

