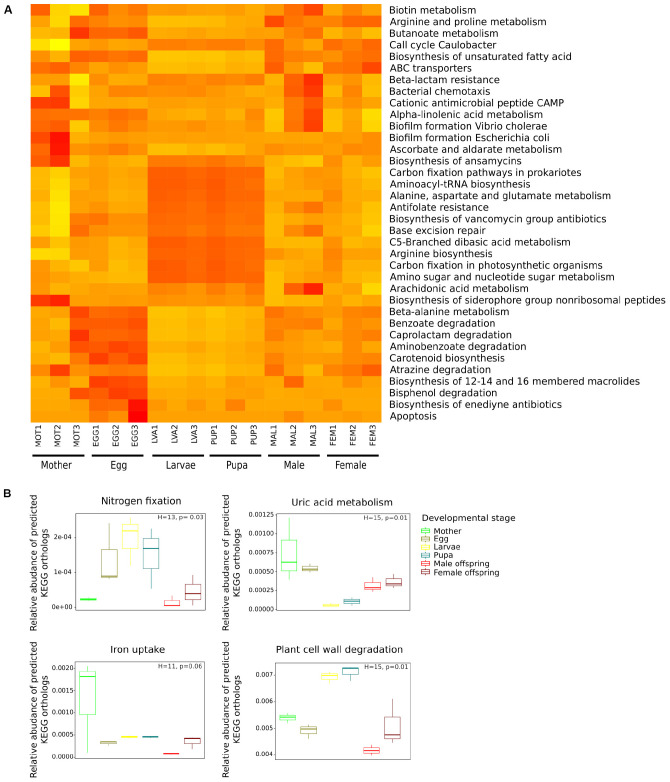
FIGURE 5.
Comparison of predicted KEGG ortholog groups (KOs) count at level 3 (A) and gene-level (B) by developmental stage. (A) Heat map of 36 categories at level 3 significant in the SIMPER analysis, each column corresponds to a C. incertus sample, and each row corresponds to a specific category. (B) Relative abundance of predicted KEGG orthologs (KOs) involved in nitrogen fixation, uric acid metabolism, iron uptake, plant cell wall degradation.

