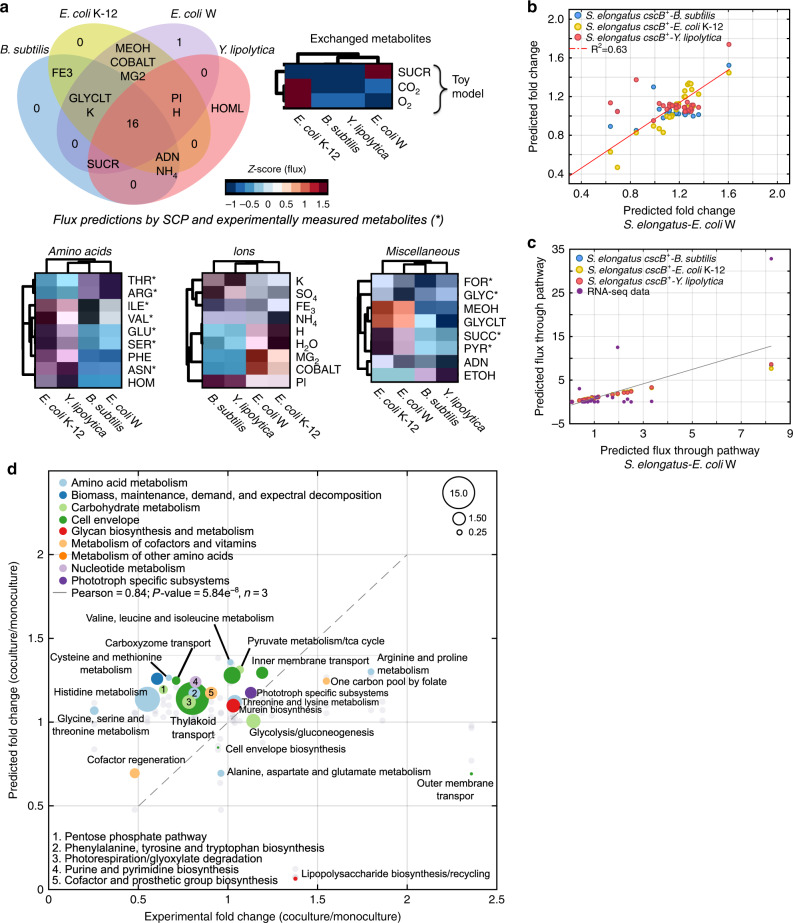
Fig. 3. Metabolic exchange is linked to differential expression in RNA-seq data and predicted flux distributions.
a The Venn diagram shows the predicted metabolic exchange for all synthetic phototrophic communities. Metabolites highlighted in bold represent the 16 (e.g., ASNL, GLUL, and ILEL) metabolites shared by all synthetic communities. Besides expected metabolites to be exchanged (CO2, O2, and sucrose), simulations show mutual transfer of amino acids, ions, and other metabolites. Marked metabolites (*) were identified in supernatant samples using target metabolomics (Tables 2, 3). b S. elongatus cscB+ fold-change analysis. Correlation between predicted subsystems fold-change of S. elongatus under cocultivation with E. coli W (x-axis) versus predicted fold-change when cultivated with B. subtilis (Pearson = 0.49, p-value = 0.011, n = 3, blue dots), E. coli K-12 (Pearson = 0.93, p-value = 9.1e−12, n = 3, yellow dots), and Y. lipolytica (Pearson = 0.33, p-value = 0.009, n = 3, red dots). c Predicted flux for each pathway in S. elongatus cocultured with E. coli W (x-axis) and other heterotrophic partners (y-axis) including B. subtilis, E. coli W, and Y. lipolytica. Flux evaluated by RNA-seq of S. elongatus cocultured with E. coli W (purple) demonstrates validation of flux prediction (Pearson = 0.82, p-value = 1.02e−7, n = 3). d Fold-change of RNA-seq data and predicted flux distributions under mono- and coculture was calculated and normalized at the pathway level. Expression data were obtained for the SPC containing E. coli W. Bubble size represents the median of expression burden and flux burden by pathway. Predicted fold-change for the microbial communities containing B. subtilis, E. coli W, and Y. lipolytica is shown in light gray dots.

