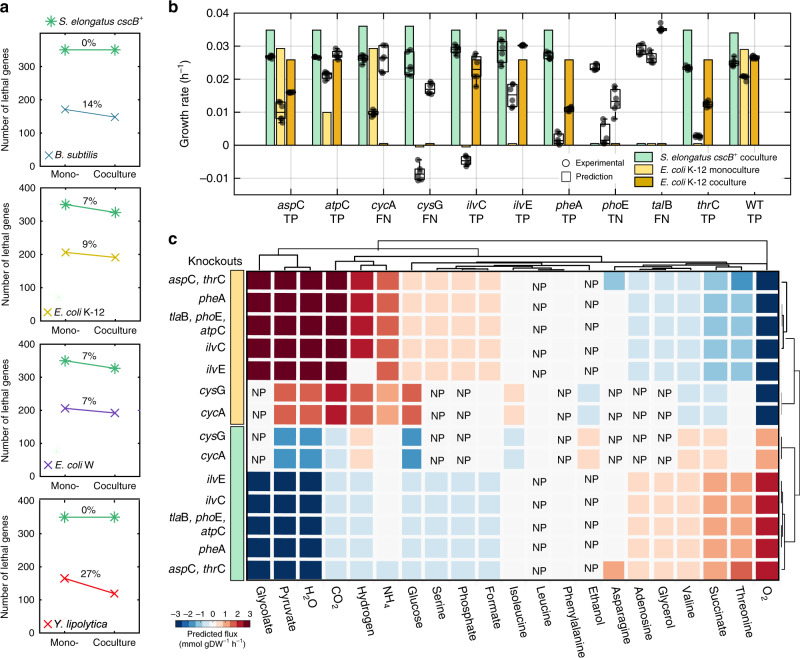
Fig. 4. Community fitness compensates for lethal phenotypic traits by tuning metabolic exchange.
a Simulations about resistance to lethal phenotypes across community members. The percentage of knockouts (KOs) with lethal phenotypes was estimated for both community members using the difference of lethal KOs among monoculture and coculture conditions. The percentage reduction is shown for S. elongatus (green) and for the heterotrophs. The communities can reduce their total lethal phenotypic outcomes by 5–9%. However, the heterotrophic partner benefited disproportionately, reducing the number of lethal traits by at least 7% for E. coli W and up to 27% for Y. lipolytica. The percentage of lethality reduction was determined using the number of genes that are lethal in monoculture vs coculture. The complete dataset is given in Supplementary Data 8, 9. b Experimental validation of selected genes with resistance phenotypes. Six E. coli K-12 mutant strains with lethal phenotypes (ilvC, cysG, ilvE, pheA, phoE, and thrC) and four with nonlethal phenotypes (aspC, cycA, talB, and atpC) were experimentally tested under monoculture and coculture conditions. Predicted growth phenotypes are shown with bars and experimental results with boxplots. In boxplots the central mark indicates the median, and the bottom and top edges of the box indicate the 25th and 75th percentiles, respectively. Benchmarking of the models is achieved by comparing experimental and predicted outcomes as true positive (TP), true negative (TN), false positive (FP), and false negative (FN). c Predicted metabolic exchange shifts in accordance with the KO studied. Complete-linkage clustering shows metabolic exchange associations by genes (y-axis) and metabolites (x-axis). The effect of each KO is shown for S. elongatus (green) and E. coli K-12 (yellow). Flux distributions were normalized by using the flux distribution obtained under wild-type conditions for both members. Predicted metabolic exchange of talB, phoE, and atpC knockouts is represented in one row as the shifts were identical. Similarly, results were found for the metabolic exchange of KOs aspC and thrC. NP stands for metabolite not predicted to exchange under given condition. Source data underlying Fig. 4b are provided as a Source Data file.

