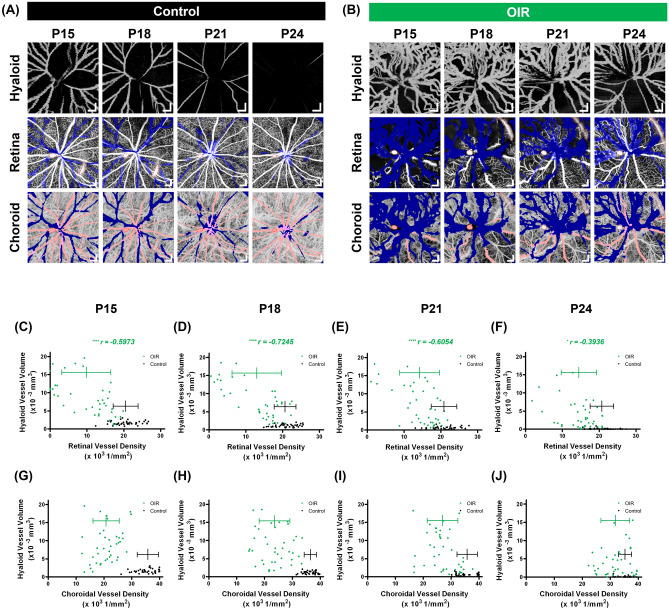
Figure 4.
Longitudinal observation of the hyaloid, retinal, and choroidal vasculatures in the control and the OIR eyes. (a,b) En face OCTA images of the three vasculatures in the control and OIR eyes (same eyes shown in Fig. 2), respectively. Artifacts enclosed by the red-dotted contours are caused by spurious reflections from the imaging optics of the OCTA system. Scale bars: 200 μm. (c–f) Correlation analyses between the hyaloid vessel volumes and the retinal vessel densities in the control (black) and the OIR (green) eyes. *P < 0.05 and ****P < 0.0001. (g–j) Correlation analyses between the hyaloid vessel volumes and the choroidal vessel densities in the control (black) and the OIR (green) eyes.

