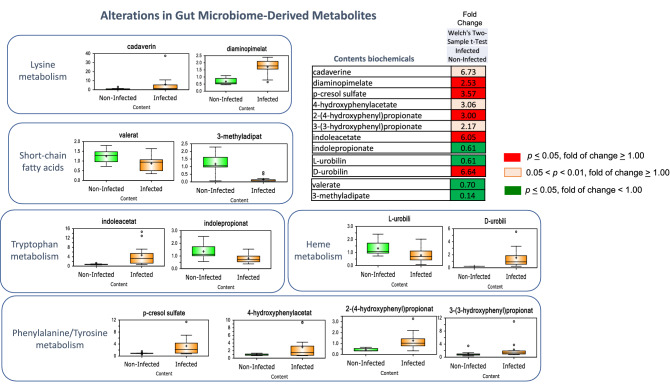
Figure 11.
Alterations in gut microbiome-derived metabolites at day 33 after inoculation. Trichuris suis induced substantial changes in metabolites derived from gut microbiome activityand in colon tissue. Differences are shown as a “Box and Whiskers” bar grafts with “ + ” as the mean value, “---" as the median value, “o” as extreme data points, box indicates upper and lower quartile with maximum and minimum of distribution range. Statistically significant (p ≤ 0.05, fold of change ≥ 1.00) increased fold change in biochemicals are shown highlighted in red and (p ≤ 0.05, fold of change < 1.00) decreased fold change highlighted in green; fold change at the level of 0.05 < p < 0.01, fold of change ≥ 1.00 that approach significance are shown in light red. Analysis was done on 11 T. suis-infected pigs (Supplemental Table S1) and nine uninfected control pigs.

