Figure 3.
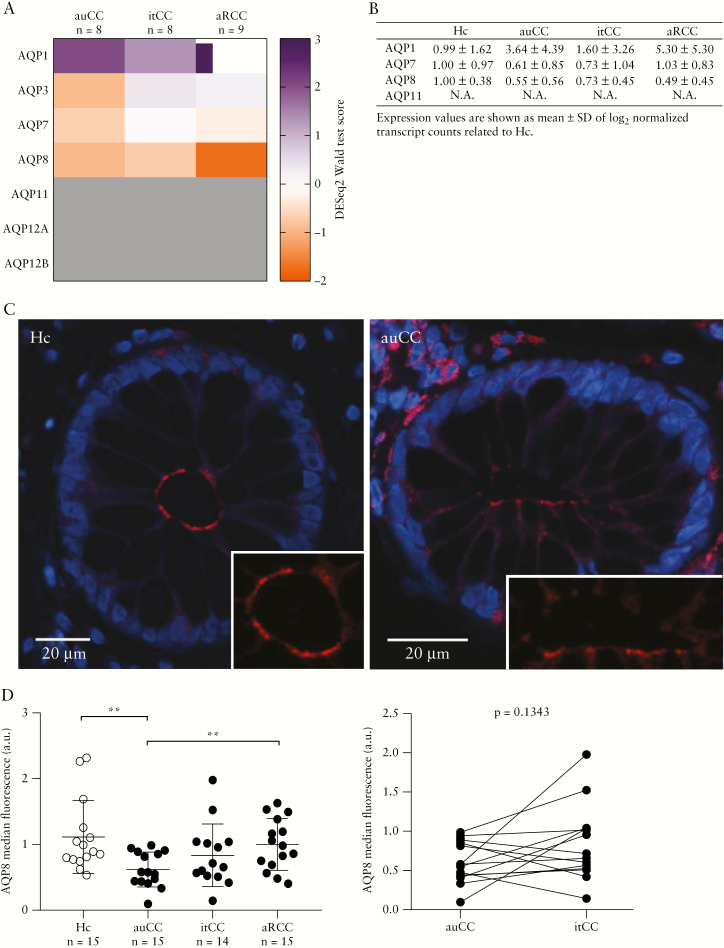
AQP8 levels are decreased in intestinal epithelial cells [IECs] of steroid-responsive CC patients. [A] Heatmap showing normalized, log2-transformed read counts [DESeq2 Wald statistic test scores] for the indicated AQP genes in CC IECs. IECs were isolated by laser capture microdissection of FFPE mucosal biopsy samples, and analysed using RNA-seq. AQPs 11, 12A and 12B [grey] did not reach the minimum threshold of 10 total reads. n = 8–9 per group. [B] Summarized AQP transcript counts [TC] in IECs, normalized to healthy control [Hc, n = 9]. Expression data are shown as mean ± SD of log2-transformed TC. n = 8–9 per group. [C] Representative confocal microscopy images of cross-sectioned epithelial glands stained for AQP8 protein [red] in FFPE sections of Hc and auCC colonic mucosa. Note that AQP8 is mainly located at the apical membrane of IECs, facing the intestinal lumen [magnified in the lower right corner]. Nuclei are shown in blue. [D] Analysis of AQP8 median fluorescence intensity, as determined by confocal microscopy [left, median with interquartile range]. Paired CC samples before [auCC] and during [itCC] successful treatment with budesonide are shown on the right. n = 14–15 per group. Statistically significant differences are shown as **p < 0.01. AQP, aquaporin; au, active untreated; aR, active/refractory; a.u., arbitrary units; CC, collagenous colitis; FFPE, formalin-fixed, paraffin-embedded; Hc, healthy controls; IEC, intestinal epithelial cell; it, inactive/treated; RNA-seq, RNA-sequencing; SD, standard deviation; TC, transcript counts.

