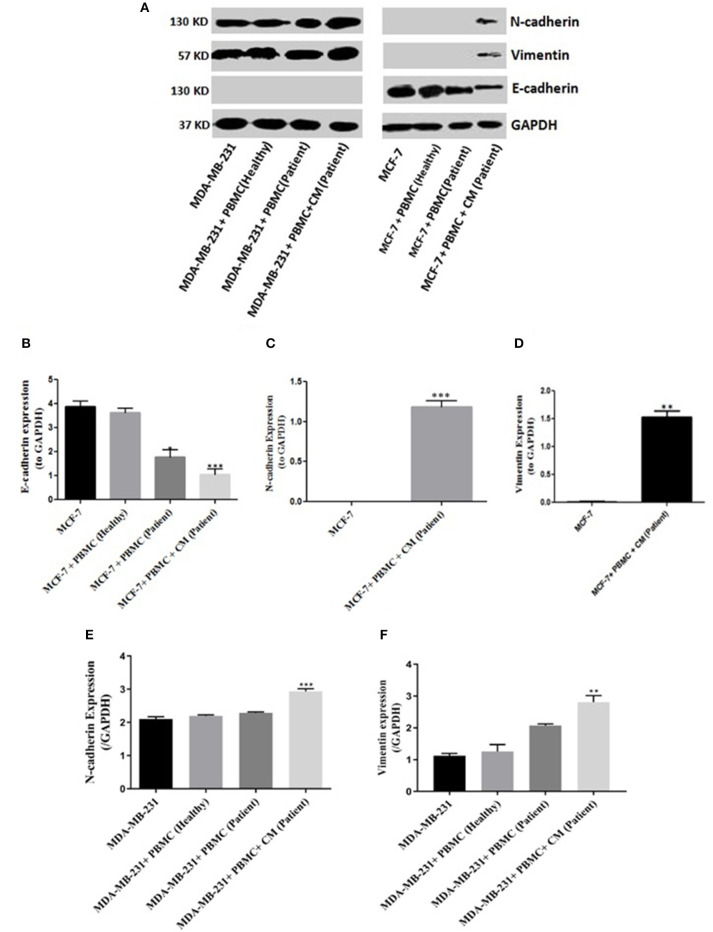
Figure 1.
EMT markers expression in breast cancer cells. Immunoblot analysis illustrates expression of various epithelial and mesenchymal markers in breast cancer cells: (A) MCF-7 cells (right column) as well as MDA-MB-231 cells (left column). (B–F) Quantification of the intensity using the ImageJ software. Data are representative of at least three independent experiments with three biological replicates (*p < 0.05, **p < 0.01, ***p < 0.001).

