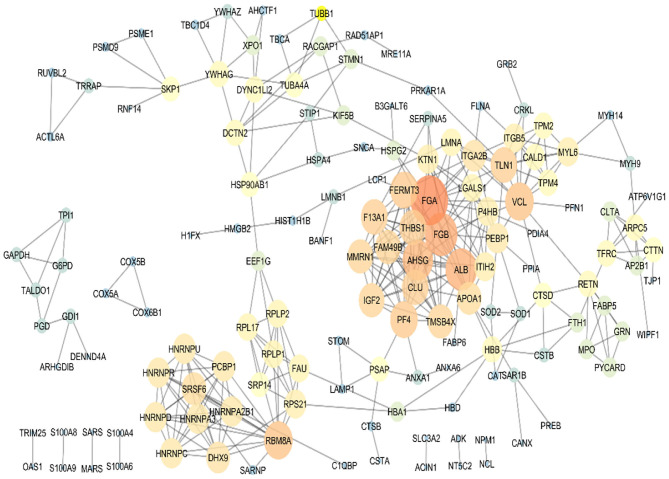
Figure 4.
Protein–protein interaction map of the differentially expressed proteins in the co-cultured PBMCs vs. PBMCs alone. Major hubs were highlighted. TMSB4X, SRSF6, and THBS1 are represented as significant signature based on the high connectivity degree value in the human protein–protein interaction networks.

