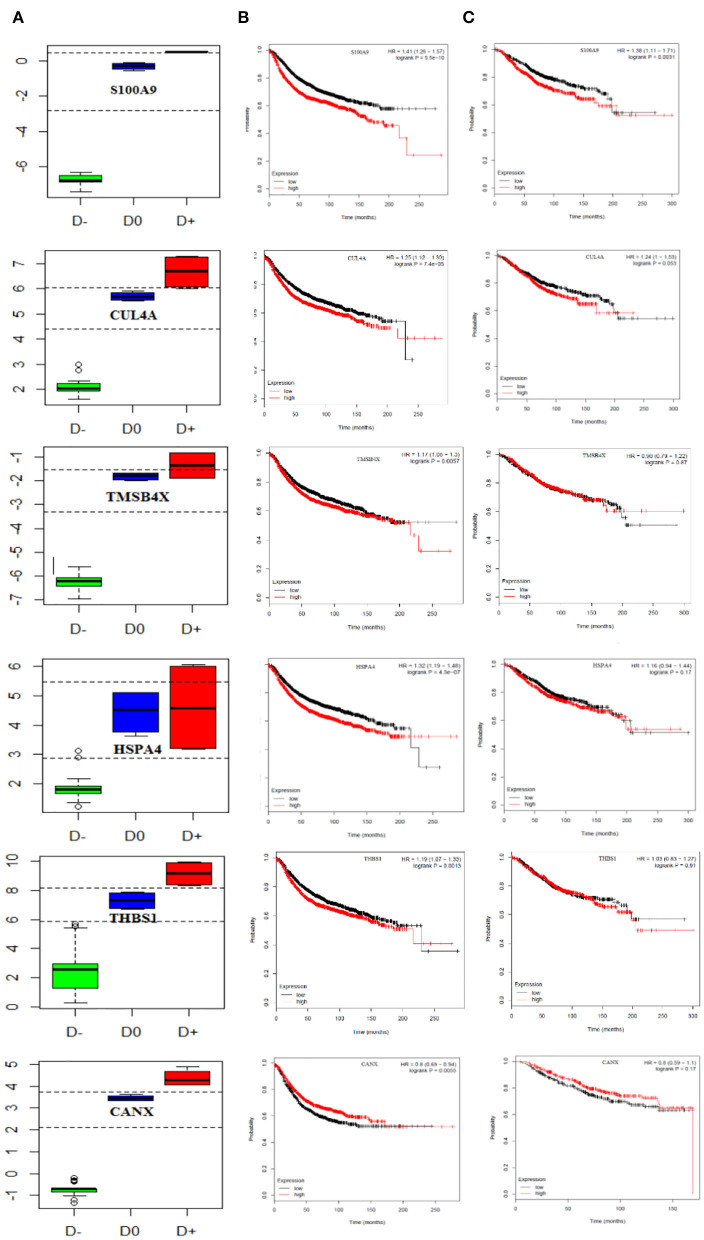
Figure 6.
Prognostic curve of the related PBMC gene signatures. (A) Boxplot of the Youden index calculated for PBMC gene signatures, S100A9, SRSF6, THBS1, CUL4A, and CANX, could accurately distinguish metastatic and primary breast cancer patients from healthy objects. D− refers to metastatic breast cancer patient, D0 healthy subjects, and D+ primary breast cancer patient cut-points (optimal cut-points indicated in dashed lines). Kaplan–Meier curves show (B) relapse-free survival in breast cancer patients and (C) overall survival and (TCGA data set). The red and black curves represent the high and low expression levels, respectively. p-values are shown at the upper-right corner. HR, hazard ratio.

