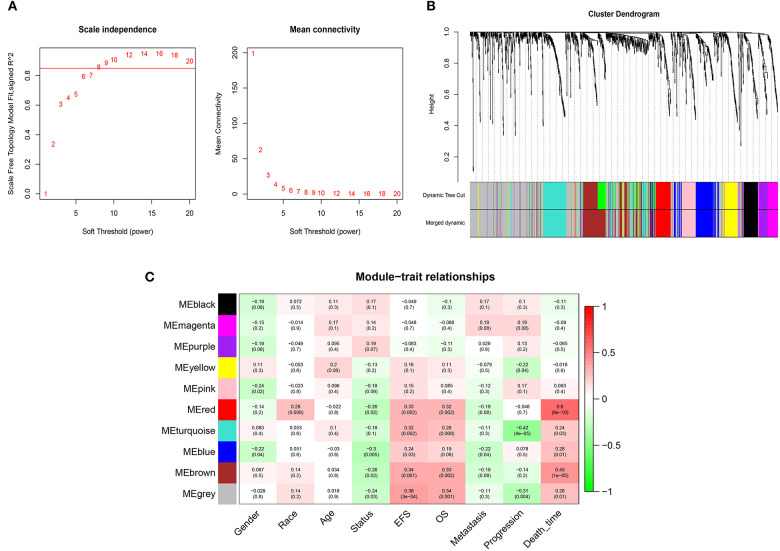
Figure 2.
WGCNA network and module detection. (A) Selection of the soft-thresholding powers. Power 8 was chosen because the fit index curve flattened out upon reaching a high value (>0.85). (B) Cluster dendrogram and module assignment for modules from WGCNA. The colored horizontal bar below the dendrogram represents the modules. (C) Correlation matrix for eigengene values and clinical features. Each cell includes the corresponding correlations and the p-values.

