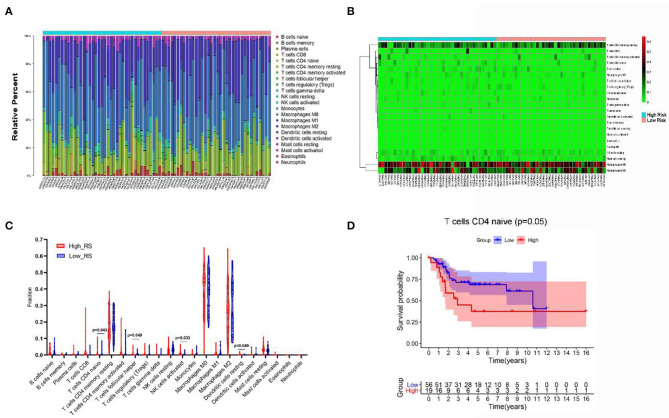
Figure 7.
The composition (A) and heat map (B) of immune cells estimated by CIBERSORT algorithm in OSs. (C) The comparison of the fractions of immune cells between high- and low-risk group. (D) Kaplan–Meier survival analysis of overall survival between high and low level of infiltrating T-cell CD4 naive.

