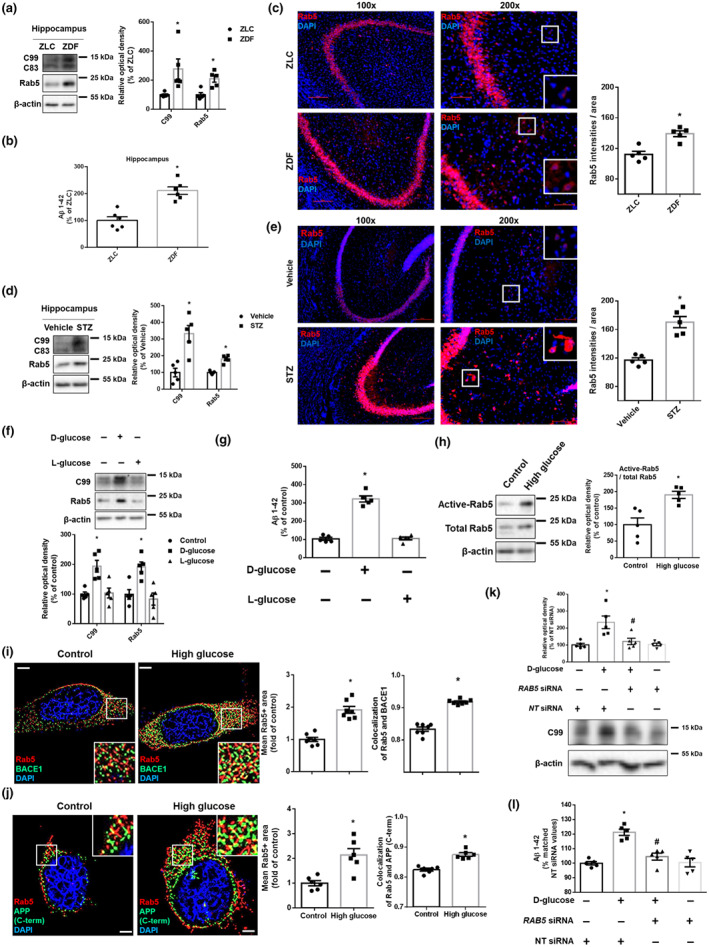
FIGURE 1.

High glucose up‐regulates Aβ production through early endosomal enlargement. (a–c) Samples were obtained from ZLC and ZDF rat hippocampus. (a) C99, Rab5, and β‐actin were detected by western blot. n = 5 in each group. (b) Aβ 1–42 were measured by rat and mouse Aβ 1–42 specific ELISA assay. n = 6 in each group with two technical replicates each. (c) Tissue slides for IHC were immunostained with Rab5‐specific antibody and counterstained with DAPI. Scale bars, 50 μm (magnification, ×200). n = 5 in each group. * P < .05, significantly different from ZLC rats. (d,e) Samples were obtained from vehicle‐ and STZ‐treated mice hippocampus. (d) C99, Rab5, and β‐actin were detected by western blot. n = 5 in each group. (e) Tissue slides for IHC were immunostained with Rab5‐specific antibody and counterstained with DAPI. Scale bars, 200 μm (magnification, ×200). n = 5 in each group. *P < .05, significantly different from vehicle‐treated mice. (f) The SK‐N‐MC cells were treated with d‐glucose (25 mM) or l‐glucose (25 mM) for 24 h. Then, C99, Rab5, and β‐actin were detected by western blot. n = 5 from independent experiments. (g) d‐glucose (25 mM) or l‐glucose (25 mM) was treated for 48 h in the cells. Then, Aβ 1–42 from cell culture medium were measured by human Aβ 1–42 specific ELISA assay. n = 5 from independent experiments with two technical replicates each. (h) The cells were treated with high glucose (25 mM) for 24 h. Active Rab5 (GTP‐bound Rab5) was immunoprecipitated with Rab5‐specific antibody (upper panels). Expression of Rab5 and β‐actin in total lysate is shown in the middle and lower panels. n = 5 from independent experiments. (i) The cells were treated with high glucose (25 mM) for 24 h which were immunostained with Rab5 and BACE1‐specific antibodies and counterstained with DAPI. Scale bars, 8 μm (magnification, ×1,000). n = 7 from independent experiments. (j) Immunostaining of cells treated with high glucose (25 mM) for 24 h was visualized. Rab5 and APP (C‐terminus)‐specific antibodies were used and counterstained with DAPI. Scale bars, 8 μm (magnification, ×1,000). n = 6 from independent experiments. *P < .05, significantly different from control. (k,l) The cells were transfected with NT siRNA or RAB5 siRNA for 12 h prior to high glucose (25 mM) treatment for 24 and 48 h, respectively. (k) C99 and β‐actin were detected by western blot. n = 5 from independent experiments. (l) Aβ 1–42 from cell culture medium were measured by human Aβ 1–42 specific ELISA assay. n = 5 from independent experiments with two technical replicates each. Logarithmic transformations were performed for homogeneity of the sample variance. * P < .05, significantly different from NT siRNA transfection, # P < .05, significantly different from high glucose with NT siRNA transfection. Quantitative data are presented as a mean ± SEM. All blots and immunofluorescence images are representative
