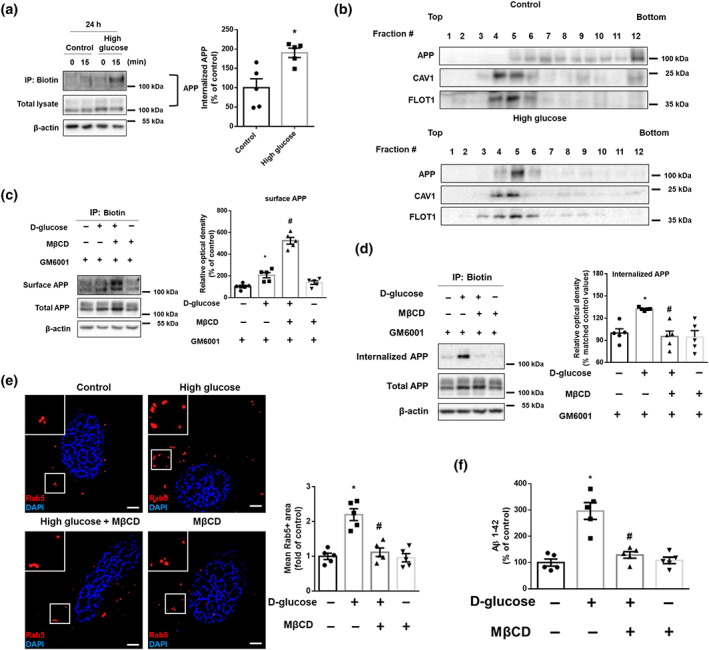
FIGURE 2.

High glucose facilitates lipid raft‐mediated APP endocytosis resulting in early endosomal enlargement. (a) Biotin surface labelling and internalization assay from the SK‐N‐MCs treated with high glucose (25 mM) for 24 h were carried out. 0 and 15 min indicate time points of internalization. In the bottom, total lysates were subjected to western blot. APP and β‐actin were detected. Percent of internalized APP was measured by normalizing with total APP at time 15 in each conditions. n = 5 from independent experiments. (b) High glucose (25 mM) was treated for 24 h in the cells. Sucrose gradient‐fractionized lysates were subjected to western blot. APP, CAV1, and FLOT1 were detected. Exploratory data. (c,d) The cells were treated with GM6001 (20 μM) for 30 min and then with MβCD (1 mM) for 30 min and high glucose (25 mM) for 24 h. (c) Cell surface was biotinylated, and labelled proteins were pulled down by streptavidin beads. Surface APP, total APP, and β‐actin were detected by western blot. n = 5 from independent experiments. (d) Biotin surface labelling and internalization assay including 15 min for internalization were carried out. Internalized APP, total APP, and β‐actin were detected by western blot. n = 5 from independent experiments. Logarithmic transformations were performed for homogeneity of the sample variance. (e) The cells were incubated with MβCD (1 mM) for 30 min prior to high glucose treatment (25 mM) for 24 h. The cells were immunostained with Rab5‐specific antibody and counterstained with DAPI. Scale bars, 8 μm (magnification, ×1,000). n = 5 from independent experiments. (f) The cells were pretreated with MβCD (1 mM) for 30 min before high glucose treatment (25 mM) for 48 h. Aβ 1–42 from cell culture medium were measured by human Aβ 1–42 specific ELISA assay. n = 5 from independent experiments with two technical replicates each. *P < .05, significantly different from control, # P < .05, significantly different from high glucose. Quantitative data are presented as a mean ± SEM. All blots and immunofluorescence images are representative
