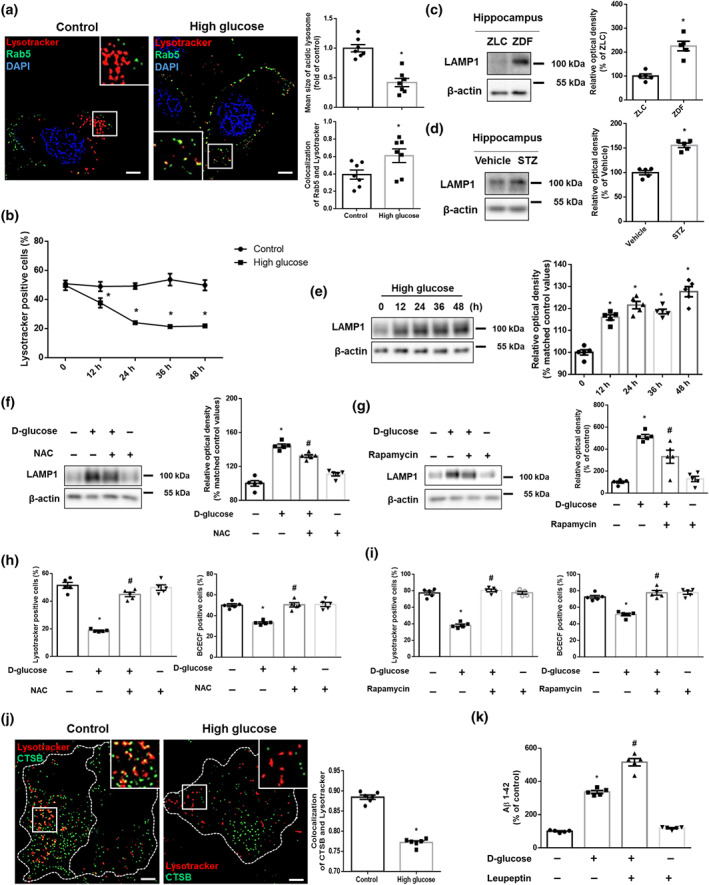
FIGURE 6.

ROS‐ and mTORC1‐mediated lysosomal dysfunction aggravates endosomal clearance and up‐regulates Aβ production. (a,j) The SK‐N‐MC cells were treated with high glucose (25 mM) for 24 h. (a) The cells were immunostained with Rab5‐specific antibody and stained with Lysotracker red and DAPI. n = 7 from independent experiments. (b) The cells treated with DW or high glucose (25 mM) were labelled with Lysotracker red and analysed by flow cytometry in a time response. n = 5 from independent experiments. *P < .05, significantly different from control. (c) The hippocampal samples were obtained from ZLC and ZDF rats. LAMP1 and β‐actin were detected by western blot. n = 5. *P < .05, significantly different from ZLC rats in each group. (d) The hippocampal samples were obtained from vehicle‐ and STZ‐treated mice. LAMP1 and β‐actin were subjected to western blot. n = 5 in each group. *P < .05, significantly different from vehicle‐treated mice. (e) The cells in a time response with 25 mM high glucose were subjected to western blot. LAMP1 and β‐actin were detected. n = 5 from independent experiments. Logarithmic transformations were performed for homogeneity of the sample variance. (f,h) The cells were pretreated with NAC (4 mM) for 30 min before high glucose treatment (25 mM) for 24 h. (f) LAMP1 and β‐actin were detected by western blot. n = 5 from independent experiments. Logarithmic transformations were performed for homogeneity of the sample variance. (g,i) The cells were incubated with Rapamycin (200 nM) for 30 min prior to high glucose treatment (25 mM) for 24 h. (g) LAMP1 and β‐actin were detected by western blot. n = 5 from independent experiments. (h,i) Intact lysosomes and intracellular pH were measured by Lysotracker red and BCECF‐AM staining, respectively. n = 5 from independent experiments. (j) The cells were immunostained with CTSB‐specific antibody and stained with Lysotracker red. (k) The cells were pretreated with leupeptin (100 nM) for 30 min before high glucose treatment (25 mM) for 48 h. Aβ 1–42 from cell culture medium were measured by human Aβ 1–42 specific ELISA assay. n = 5 from independent experiments with two technical replicates each. *P < .05, significantly different from control, # P < .05, significantly different from high glucose. Quantitative data are presented as a mean ± SEM. All blots and immunofluorescence images are representative
