
FIGURE 2.
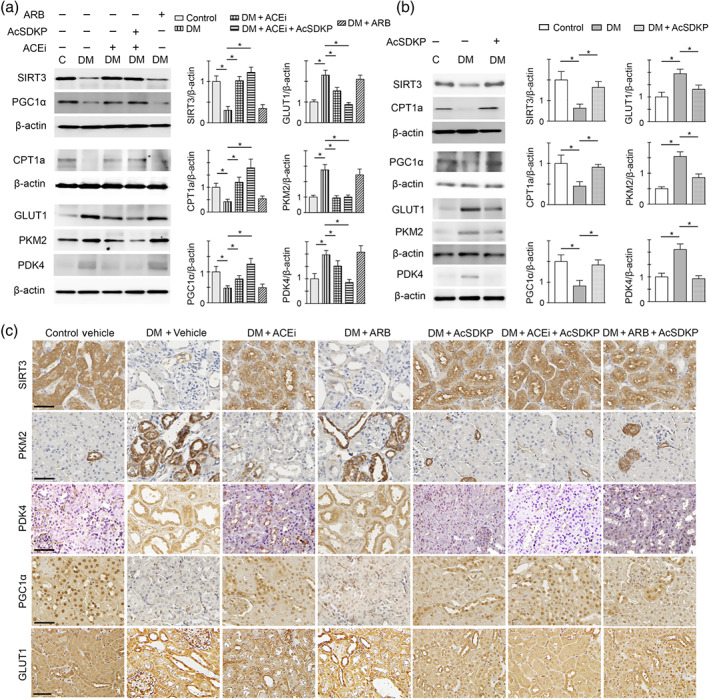
AcSDKP restores central metabolism in diabetic kidney disease. (a) Western blot analysis of SIRT3, PGC1α, CPT1a, GLUT1, PKM2 and PDK4 in the kidney of control, diabetic, ACE inhibited with imidapril (ACEi), combination (ACEi + AcSDKP) and TA‐606 (AT1 receptor blockade; ARB)‐treated diabetic mice. Representative pictures from five blots are shown. Densitometry quantification of SIRT3, PGC1α, CPT1a, GLUT1, PKM2 and PDK4 was performed on ImageJ. The data were normalized to β‐actin. The kidneys of five mice were analysed. (b) Western blot analysis of SIRT3, PGC1α, CPT1a, GLUT1, PKM2 and PDK4 in the kidneys of the control, diabetic and AcSDKP‐treated diabetic mice. Representative pictures from five blots are shown. Densitometry quantification of SIRT3, PGC1α, CPT1a, GLUT1, PKM2 and PDK4 was performed on ImageJ. The data were normalized to β‐actin. The kidneys of five mice were analysed. The data are expressed as the means ± SEM and are included in the graph. (c) Immunohistochemistry analysis of SIRT3, PKM2, PDK4, PGC1α and GLUT1 in the kidneys of the control, diabetic and ACEi, ARB, AcSDKP, ACEi + AcSDKP and ARB + AcSDKP‐treated diabetic CD‐1 mice. Five mice were analysed in each group. Representative pictures in each panel are shown. Scale bar: 50 μm. Data in the graph are presented as mean ± SEM. Statistical significance: * P < 0.05. DM represents diabetic group