
FIGURE 3.
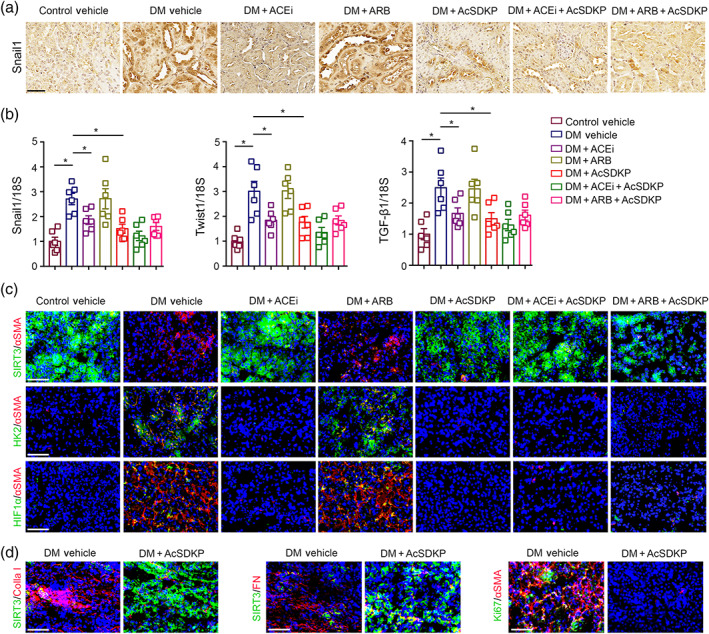
AcSDKP disrupts the metabolic reprogramming of myofibroblasts in diabetic kidneys. (a) Immunohistochemistry analysis of Snail1 in the kidney of non‐diabetic control, diabetic (DM) and imidapril (ACE inhibition; ACEi), TA‐606 (AT1 receptor blockade; ARB), AcSDKP, ACEi + AcSDKP and ARB + AcSDKP‐treated diabetic CD‐1 mice. Representative pictures are shown. Scale bar: 50 μm. Five mice were analysed in each group. (b) Gene expression analysis of Snail1, Twist1 and TGFβ1 by qPCR in the kidneys of indicated groups. The kidneys of six mice were analysed in each group. (c) Co‐immunofluorescence analysis of SIRT3/αSMA/DAPI, HK2/αSMA/DAPI and HIF1α/αSMA/DAPI in the kidneys of indicated groups. Representative pictures are shown. Scale bar: 50 μm. In the first set of experiments, SIRT3 FITC labelled green, αSMA rhodamine labelled and DAPI blue; in the second set of experiments, HK2 FITC (green) labelled, αSMA rhodamine labelled and DAPI blue. In the third set of experiments, HIF1α FITC labelled green, αSMA rhodamine labelled and DAPI blue. The kidneys of five mice were analysed in each group. (d) Co‐immunofluorescence analysis of SIRT3/collagen‐I, SIRT3/fibronectin and proliferation marker ki67 with αSMA was analysed. The kidneys of five mice were analysed in each group. Scale bar: 50 μm. Representative pictures in each panel are shown. Data in the graph are presented as mean ± SEM. Statistical significance: * P < 0.05. DM represents diabetic group