
FIGURE 6.
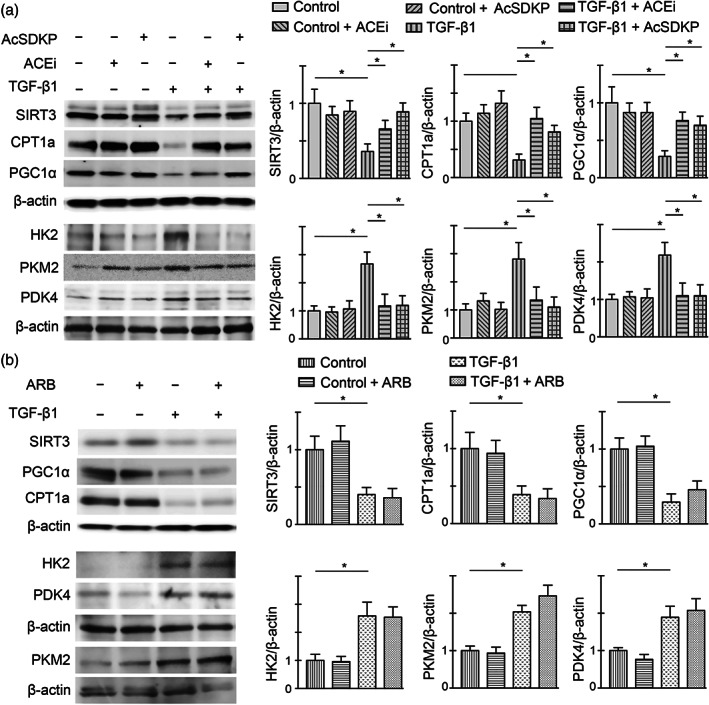
ACE inhibition and AcSDKP stimulation cancel the TGFβ1‐driven abnormal metabolism in vitro. (a) Western blot analysis of SIRT3, CPT1a, PGC1α, HK2, PKM2 and PDK4 in the imidapril (ACE inhibition; ACEi) and AcSDKP‐treated tubular epithelial cells (HK‐2 cells) in the presence and absence of TGFβ1 (25 ng·ml−1) in high glucose condition. Representative blots are shown. Quantification of SIRT3, CPT1a, PGC1α, HK2, PKM2 and PDK4, respectively, by densitometry. The data were normalized to β‐actin. Five independent sets of experiments were analysed. (b) Western blot analysis of SIRT3, CPT1a, PGC1α, HK2, PKM2 and PDK4 in the ARB‐treated HK‐2 cells in the presence and absence of TGFβ1 in high glucose condition. Representative blots are shown. Quantification of SIRT3, CPT1a, PGC1α, HK2, PKM2 and PDK4, respectively, by densitometry. The data were normalized by β‐actin. Five independent sets of experiments were analysed. Data in the graph are presented as mean ± SEM. Statistical significance: * P < 0.05