
FIGURE 8.
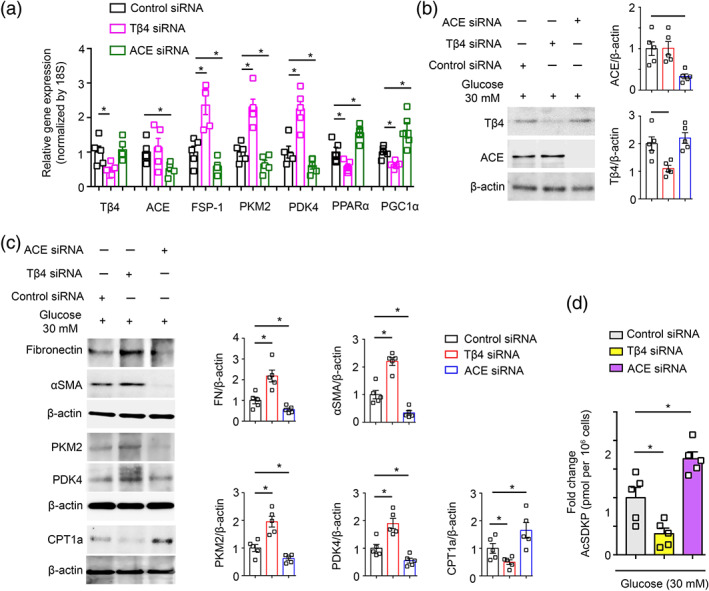
Thymosin β4 knockdown disrupts whereas ACE knockdown improves the central metabolism. (a) Gene expression analysis of Tβ4, ACE, FSP‐1, PKM2, PDK4, PPARα and PGC1α by qPCR in the Tβ4 siRNA, and ACE siRNA transfected high glucose (30 mM 48 h pretreated)‐treated HK‐2 cells. Five independent sets of experiments were analysed. Gene expression data were normalized by 18S. (b) Western blot analysis of Tβ4 and ACE in the Tβ4 siRNA and ACE siRNA transfected high‐glucose‐treated HK‐2 cells. Five independent sets of experiments were analysed. Densitometry calculations were normalized to β‐actin. Representative blots are shown. (c) Western blot analysis of fibronectin, αSMA, PKM2, PDK4 and CPT1a in the Tβ4 siRNA and ACE siRNA transfected HK‐2 cells. Five independent sets of experiments were analysed. Densitometry calculations were normalized to β‐actin. Representative blots are shown. (d) AcSDKP levels were measured in the cell medium of Tβ4 siRNA and ACE siRNA transfected HK‐2 cells. Five independent sets of experiments were analysed. Data in the graph are presented as mean ± SEM. Statistical significance: * P < 0.05