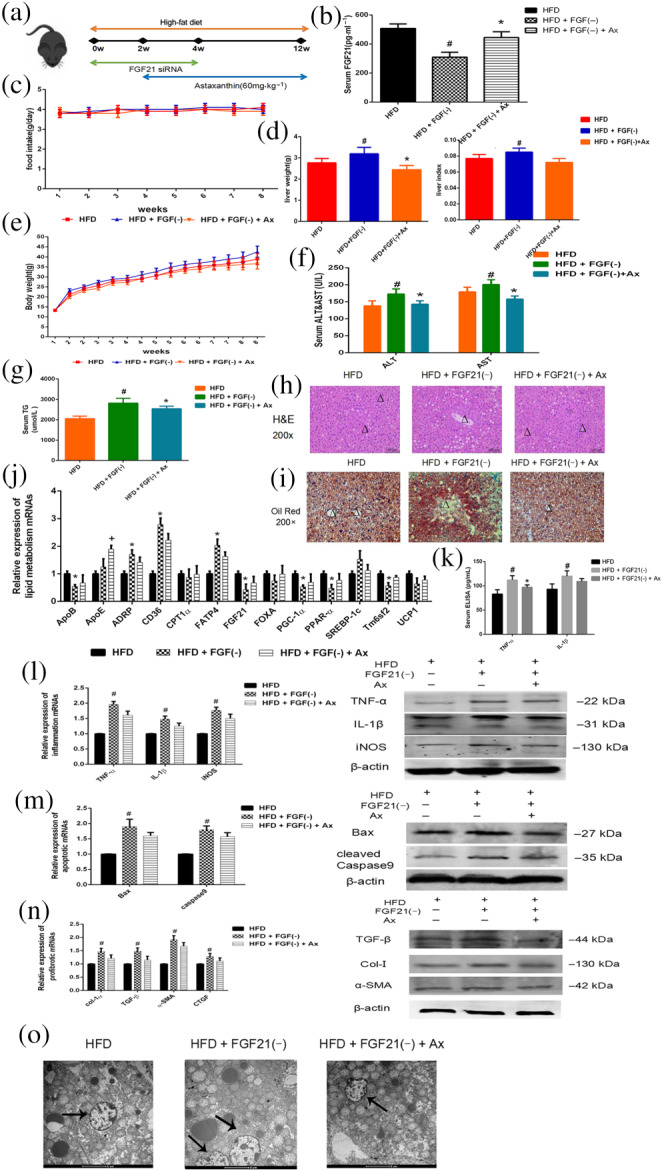
FIGURE 5.

FGF21 down‐regulation aggravated liver damage in HFD‐fed mice. (a) Experimental flow chart; (b) serum FGF21 levels; (c) food intake; (d) liver weight and liver index; (e) bodyweight; (f) serum ALT and AST levels; (g) serum TG levels; (h) H&E staining (×200) of livers (central veins were marked as Δ); (i) Oil Red O staining (×200) of livers (central veins were marked as Δ); (j) relative expressions of lipogenesis related genes in livers; (k) Serum ELISA levels of TNF‐α and IL‐1β; (l) expression of mRNA and protein levels of inflammatory genes; (m) Expression of mRNA and protein levels of apoptotic genes; (n) Expression of mRNA and protein levels of profibrotic genes; (o) mitochondria under electron microscopy (×1900) (mitochondria were marked by arrows). Data shown are means ± SEM; n = 7 in each group. # P<.05, significantly different from HFD; * P<.05, significantly different from HFD + FGF(−)
