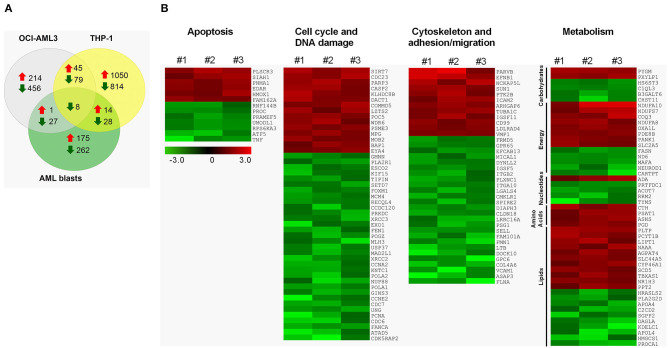
Figure 4.
Transcriptomic alterations induced by DEN in AML. (A) The number of upregulated and downregulated genes after 24 h of denatonium exposure in primary AML cells (0.5 mM), OCI-AML3 (0.1 mM), and THP-1 (0.5 mM) cell lines. (B) Heatmap of differentially expressed genes involved in apoptosis, cell cycle and DNA damage, cytoskeleton, cell adhesion and migration, and metabolism, following exposure to denatonium in three primary AML sample. Columns represent ratios between DEN- and vehicle-treated cells for each case. Color changes are quantified by the scale bar. Genes are ranked according to their fold change.

