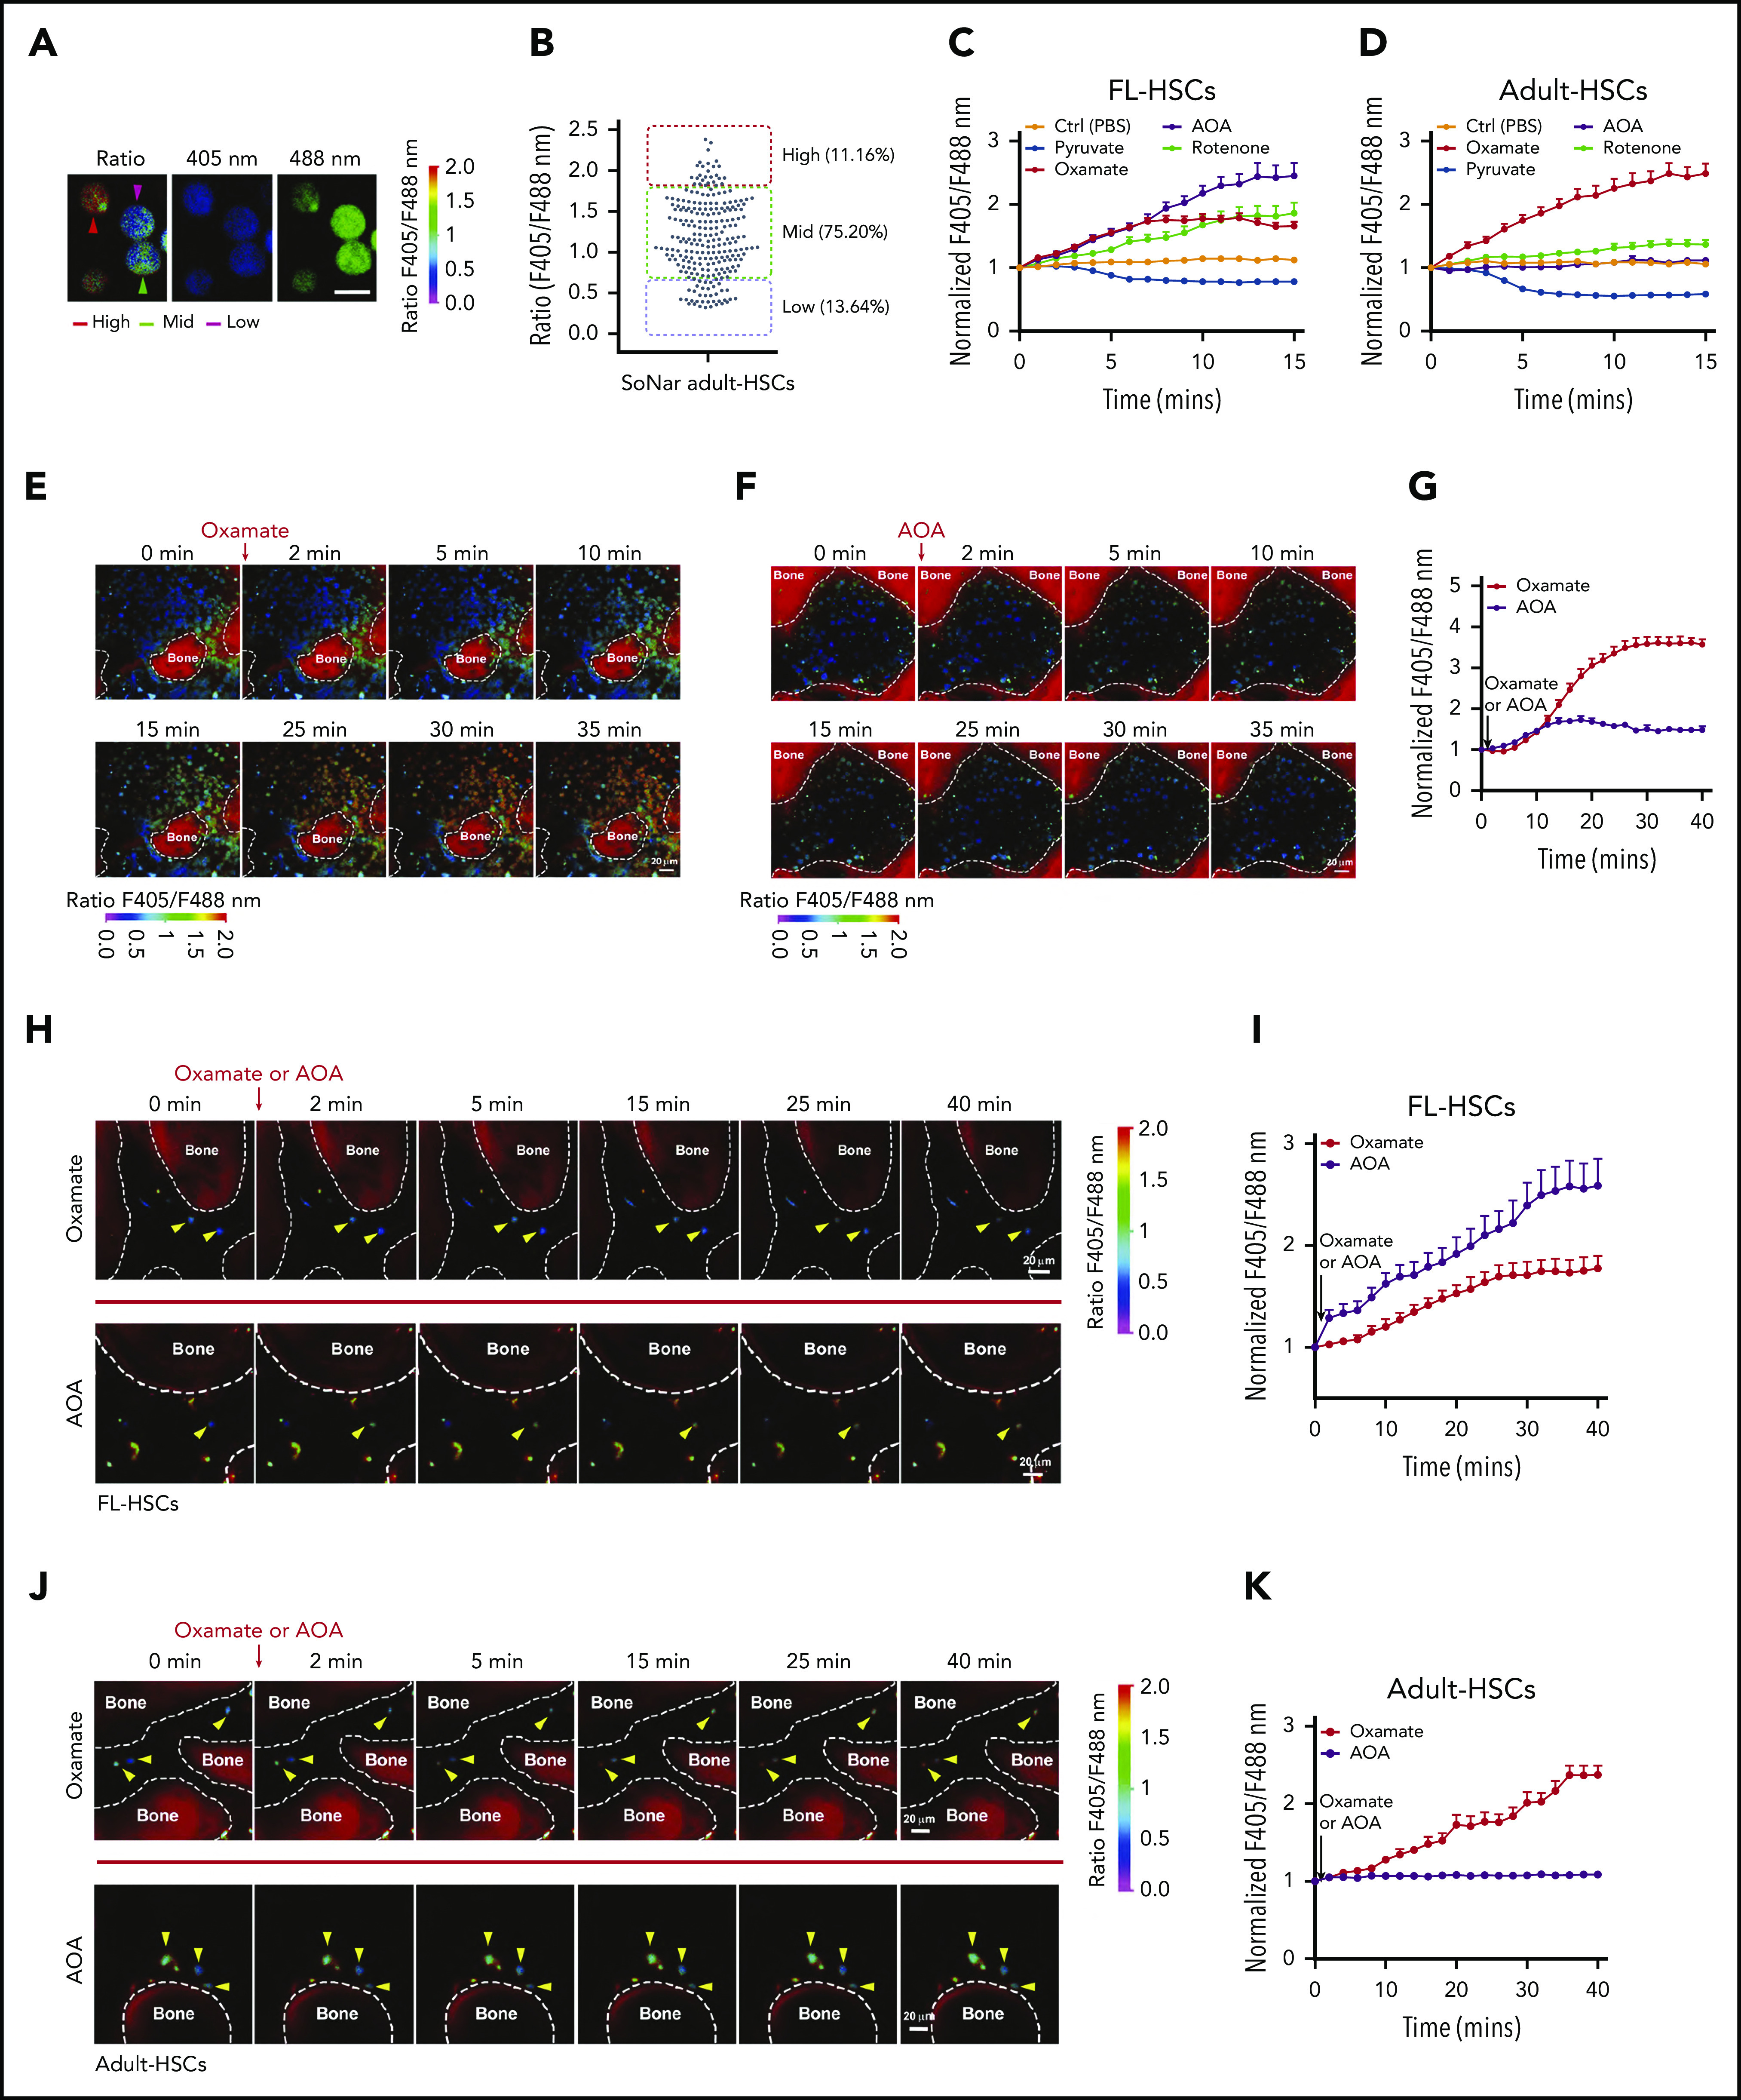
Figure 5.

FL-HSCs respond differently to AOA stimulation in the BM niche compared with adult HSCs. (A-B) Representative images of the ratios of SoNar fluorescence of BM adult HSCs (A); a total of 242 adult HSCs were examined, and quantitative data are shown (B; n = 3). Scale bar, 10 μm. (C-D) Dynamic changes of the ratios of SoNar fluorescence in FL-HSCs and adult HSCs at indicated time points upon metabolic stimulations. A total of 25 to 30 FL-HSCs (C) or adult HSCs (D) were examined (n = 3). (E-G) Representative images of the ratios of SoNar fluorescence of total BM cells in the cranium at indicated time points upon oxamate (E) or AOA (F) incubation; a total of 30 SoNar BM cells were examined, and quantitative data are shown (G; n = 3). (H-I) Representative images of the changes of the ratios of SoNar fluorescence upon oxamate or AOA incubation in the cranium of recipients receiving FL-HSCs (yellow arrowheads) 16 hours after transplantation (H); a total of 20 to 22 SoNar FL-HSCs were examined, and quantitative data are shown (I; n = 3). (J-K) Representative images of the changes of the ratios of SoNar fluorescence upon oxamate or AOA incubation in the cranium of recipients receiving adult HSCs (yellow arrowheads) 16 hours after transplantation (J); a total of 22 to 24 SoNar adult HSCs were examined, and quantitative data are shown (K; n = 3). Data are represented as mean ± standard error of the mean. Scale bar, 20 μm. See also supplemental Figure 5.
