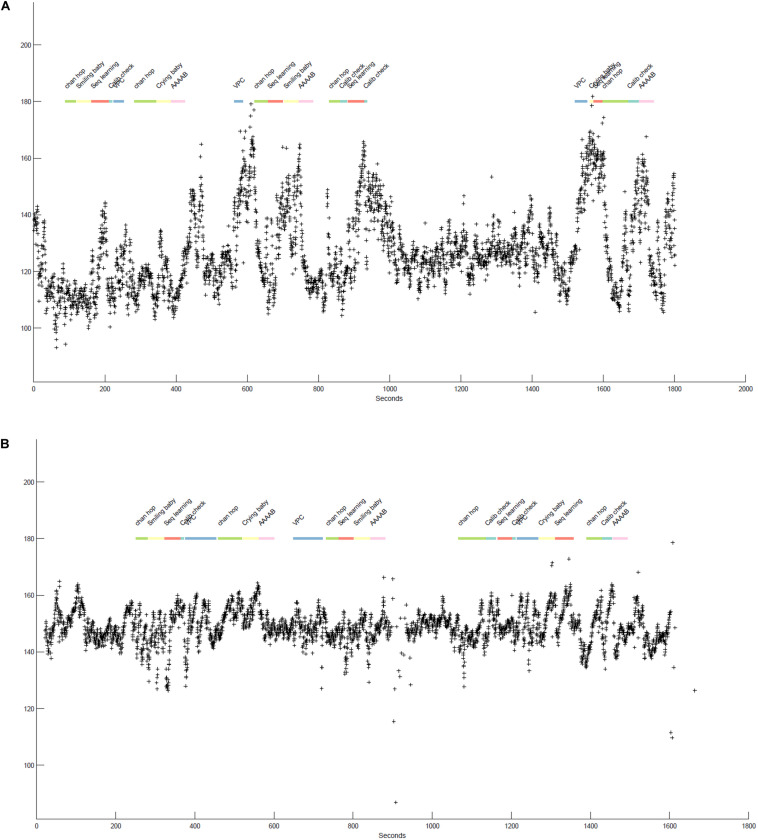
FIGURE 2.
(A,B) illustrate the beat-by-beat heart rate data (indicated by + symbols) of two infants participating in various tasks over the course of a laboratory session. The x-axis shows time (in seconds) and the y-axis specifies the heart rate values in equivalent beats-per-minute. The colorful line at the top represent the specific tasks infants participated in, differentiated by color and labels. The boundaries of each segment indicate the start and stop times of each task.

