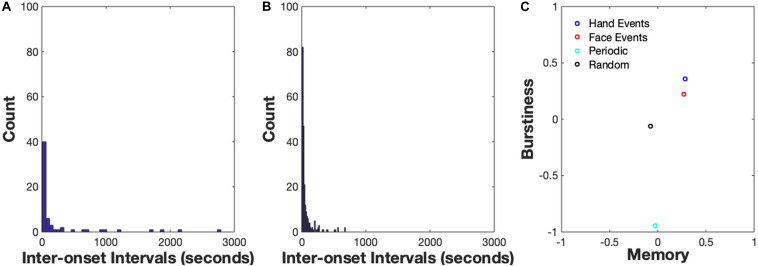
FIGURE 4.
(A) Inter-onset Interval Distribution for hand events, (B) Inter-onset Interval Distribution for face events. An IOI distribution for a periodic signal (B < 0), the user would observe high counts of IOIs in one particular timescale, e.g., a high amount of IOIs with length = 10 s. An IOI distribution for a bursty signal (B > 0) is typically right-skewed, suggesting a high frequency of short IOIs and less-frequent (but non-zero) amount of longer IOIs. (C) Burstiness-Memory plot. On the x-axis is a measure of the memory of the event series which is commonly estimated by the lag-1 autocorrelation coefficient.

