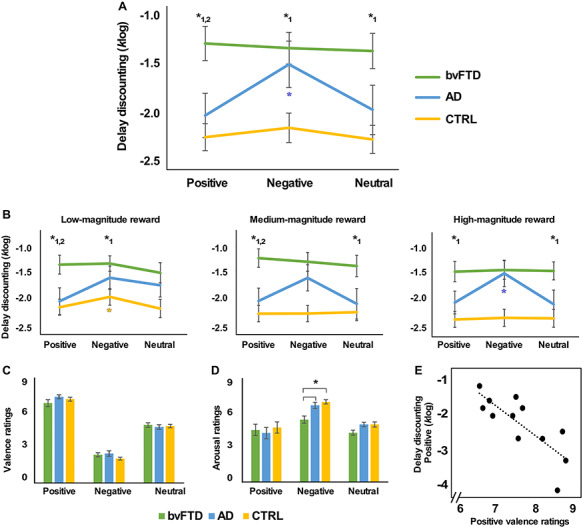
Figure 2.

Behavioral results and correlations. A. Average delay discounting rates (k, log transformed) for each Emotion condition (Positive, Negative and Neutral) and Group (behavioral-variant frontotemporal dementia, bvFTD; Alzheimer’s disease, AD; controls, CTRL). B. Delay-discounting rate for low-, medium- and high-magnitude rewards. C, D. Judgement of valence and arousal for each Emotion condition and Group. E. Correlation between delay discounting in the Positive condition and positive valence ratings in the AD group. Graph lines and bars show means and standard error of the mean. * indicates significant post hoc differences (P < 0.05, Sidak corrected for multiple comparisons) for bvFTD < AD, CTRL (*1) and bvFTD = AD < CTRL (*2). Colored * indicates effects of Emotion in each Group.
