
Fig. 4.
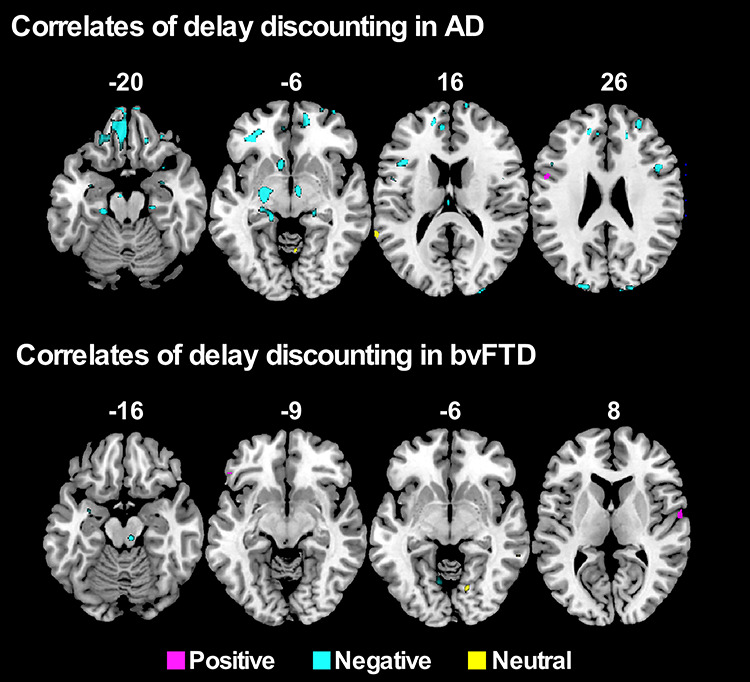
VBM analyses showing regions negatively correlated with delay discounting in AD and bvFTD in the Positive, Negative and Neutral conditions (P < 0.001 uncorrected for multiple comparisons). Age and total intracranial volume included as a covariate in all VBM analyses. Clusters are overlaid on the standard MNI brain. The left side of the image is the left side of the brain.