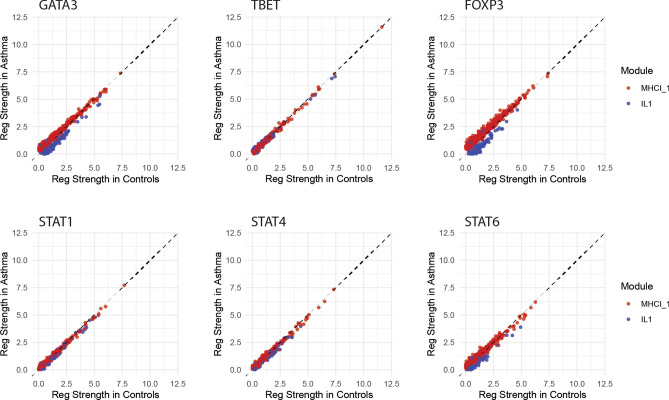
Figure 4.
Asthma regulatory networks demonstrate extensive alterations, with both increased and decreased transcription factor (TF) regulation strength. Regulatory strengths outputted from PANDA are displayed for several example TFs in two representative WGCNA modules (MHCI_1 and IL1). The y axis represents regulatory strength in the asthma network while the x axis represents regulatory strength in the control network. Each individual point represents the regulatory strength of the given TF on each of its gene targets in the representative modules. Points above and below the y = x line respectively indicate stronger regulation in asthma relative to controls, and controls relative to asthma.

