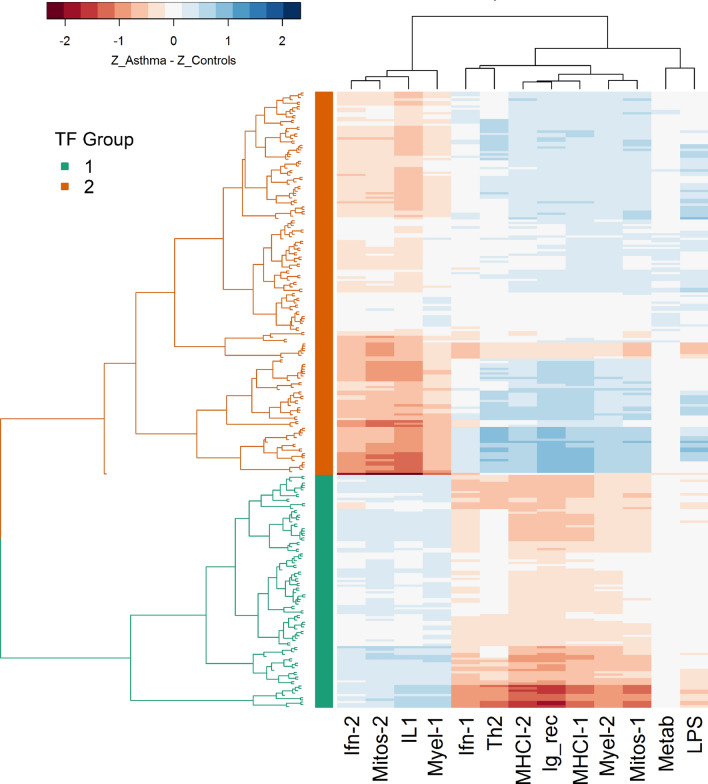
Figure 5.
Transcription factors (TFs) cluster into groups based upon the pattern of their regulatory alteration across gene expression modules. A heatmap of the median regulatory shift of targets within each gene expression module (for a given TF: median value of zAsthma–zControl across targets within a module). The x axis represents different WGCNA modules, while TFs are represented on the y axis, with branches colored by TF communities from hierarchical clustering. Blue/positive values represent stronger regulatory control in asthma, while red/negative values represent strong regulatory control in controls.

