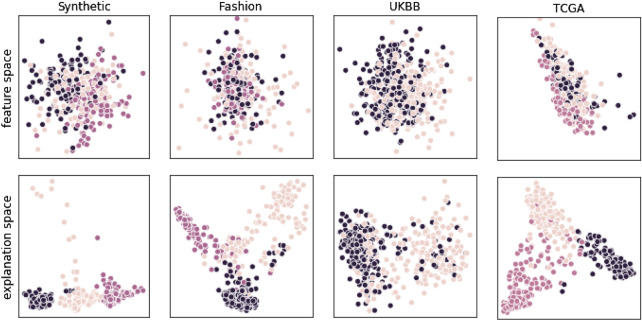
Figure 1.
Projection into first two principal components after PCA of feature space (top row) and explanation space (bottom row) of Synthetic, Fashion-MNIST, UK Biobank Brain-Age, and Cancer Genome Atlas datasets. Shown are the (sub-)classes of the three-class superset used for binary classification. As can be seen, clusters are well defined in explanation space; for biomedical datasets, these sub classes correspond to real subtypes. For example in TCGA (rightmost plot), the visible clusters correspond to Wound Healing (black), IFN-gamma Dominant (yellow), and Inflammatory (pink) cancer tissue immune model types.

