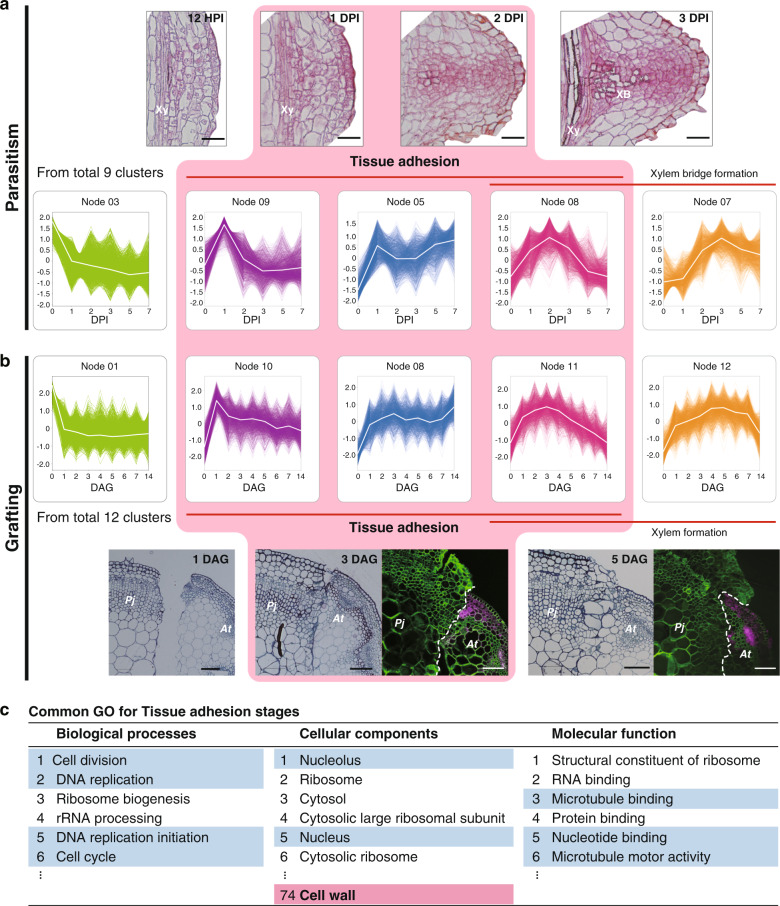
Fig. 4. Comparison of self-organizing map (SOM) clusters associated with the tissue adhesion stage during parasitism and grafting.
a, b Tissue sections of the parasitized site of P. japonicum 12 h post infection (HPI), 1, 2, and 3 DPI (a) and the graft junction between P. japonicum (Pj) and Arabidopsis (At) 1, 3, and 5 DAG (b). Fluorescence images of the graft junction are also shown where P. japonicum was grafted onto Arabidopsis harboring RPS5a::LTI6b-tdTomato (b). Green indicates the cell wall, magenta indicates tdTomato fluorescence. Xy xylem, XB xylem bridge. SOM clusters with similar patterns in parasitism (a) and grafting (b) are shown. c Enriched gene ontology (GO) terms common to parasitism and grafting are listed for the clusters. Nodes 5, 8, and 9 were merged from the SOM cluster of the P. japonicum parasitism transcriptome, and nodes 8, 10, and 11 were merged from the SOM cluster of the P. japonicum grafting transcriptome. A portion of the GO terms categorized as “biological processes”, “cellular components”, and “molecular functions” are shown. GO terms potentially associated with “cell division” and “cell wall modification” are marked in blue and red, respectively. Scale bars, 50 µm (a), and 100 µm (b).

