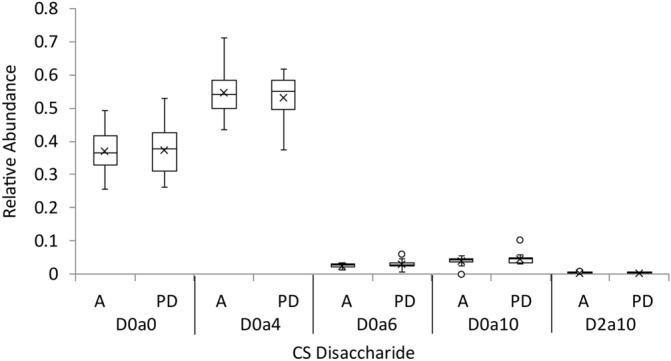
Figure 2.

CS glycomics of human brain prefrontal cortex aged with no neurological disease (A) and aged with Parkinson’s disease (PD) from cohort 1. CS Disaccharide abundances, D0a0 ΔHexAGalNAc, D0a4 ΔHexAGalNAc4S, D0a6 ΔHexAGalNAc6S, D0a10 ΔHexAGalNAc4S,6S. Detailed structures are shown in Supplementary Fig. S4. Whiskers show maximum and minimum values. The top and bottom of each box show the 75th and 25th percentile of the sample, respectively. The line through each box shows the median and the x marker the mean of the samples.
