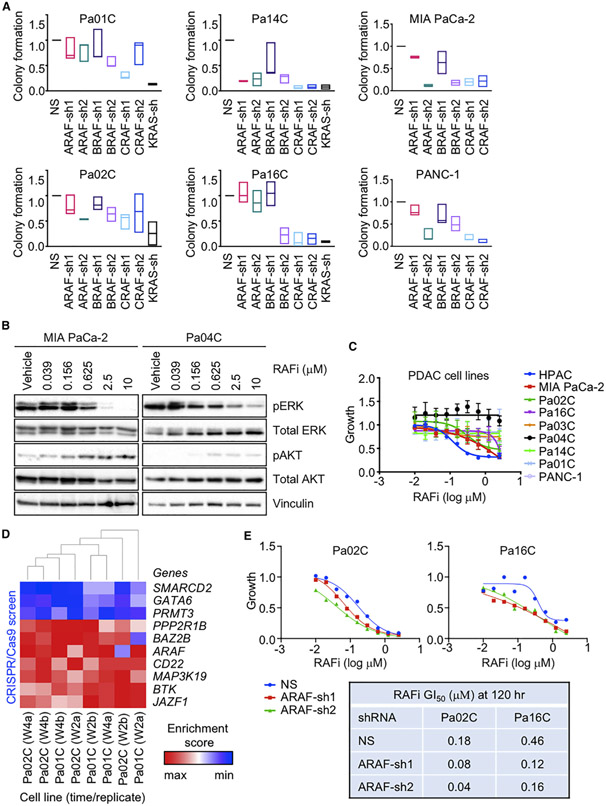
Figure 1. Concurrent Inhibition of All RAF Isoforms Diminishes PDAC Growth.
(A) PDAC cell lines were infected by lentivirus vectors encoding nonspecific (NS) control or distinct shRNAs targeting ARAF, BRAF, CRAF, or KRAS sequences. Colonies were stained by crystal violet ~10 days after plating. Data are presented as median. All p values shown are in comparison to the vehicle control for the individual graph. Adjusted p values are from Dunnett’s multiple comparison test. Adjusted p values: Pa01C (ARAF-sh1 = 0.6792, ARAF-sh2 = 0.6726, BRAF-sh1 = 0.8883, BRAF-sh2 = 0.0592, CRAF-sh1 = *, 0.0024, CRAF-sh2 = 0.6350), (KRAS-sh = ***, 0.0010). Pa02C (ARAF-sh1 = 0.7153, ARAF-sh2 = 0.0692, BRAF-sh1 = 0.8788, BRAF-sh2 = 0.1990, CRAF-sh1 = 0.0539, CRAF-sh2 = 0.2738), (KRAS-sh = **, 0.0068). Pa14C (ARAF-sh1 = ****, < 0.0001, ARAF-sh2 = ****, < 0.0001, BRAF-sh1 = *, 0.0103, BRAF-sh2 = ****, < 0.0001, CRAF-sh1 = ****, < 0.0001, CRAF-sh2 = ****, < 0.0001, KRAS-sh = ****, < 0.0001). Pa16C (ARAF-sh1 = 0.9995, ARAF-sh2 = 0.7500, BRAF-sh1 = 0.9977, BRAF-sh2 = ****, < 0.0001, CRAF-sh1 = ****, < 0.0001, CRAF-sh2 = ****, < 0.0001, KRAS-sh = ****, < 0.0001). MIA PaCa-2 (ARAF-sh1 = 0.5520, ARAF-sh2 = **, 0.0051, BRAF-sh1 = 0.2316, BRAF-sh2 = **, 0.0076, CRAF-sh1 = **, 0.0086, CRAF-sh2 = **, 0.0098). PANC-1 (ARAF-sh1 = 0.3213, ARAF-sh2 = ****, < 0.0001, BRAF-sh1 = 0.0586, BRAF-sh2 = **, 0.0025, CRAF-sh1 = ****, < 0.0001, CRAF-sh2 = ****, < 0.0001).
(B) PDAC cell lines were treated with RAFi (0.04–10 μM, 72 h). Cell lysates were immunoblotted to determine levels of the indicated proteins. Data are representative of three independent experiments.
(C) PDAC cell lines were treated with RAFi (0.01–2.5 μM, 72 h). Proliferation was measured by Calcein AM cell viability assay. Data are the mean average of three independent experiments. Error bars are shown as ± SEM.
(D) CRISPR screen. PDAC cell lines were infected with the CRISPR library and treated with vehicle control or RAFi (w2, 2 weeks; w4, 4 weeks; a and b indicate replicate samples). The enrichment score indicates either enrichment (red) or depletion (blue) of the indicated genes in cells treated with RAFi relative to vehicle control.
(E) Cell lines were infected by lentivirus vectors encoding NS or two distinct ARAF shRNAs (72 h) and treated with RAFi (0.01–2.5 μM, 120 h). Proliferation was measured by Calcein AM cell viability assay. Data are the mean average of three technical replicates. Error bars are shown as ± SEM. Summary of GI50 values.

