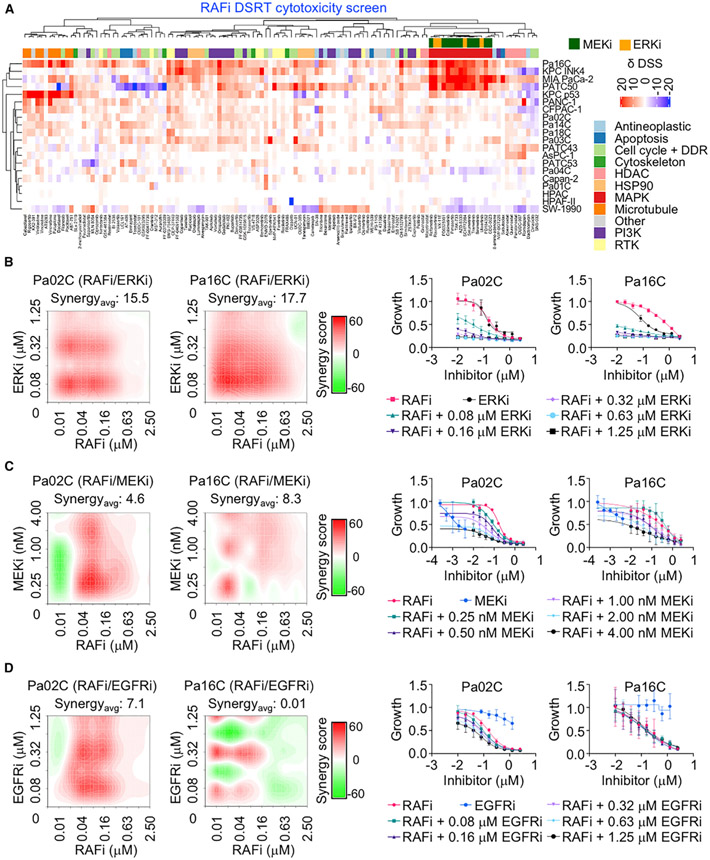
Figure 2. Identification of Synergistic Drug Combinations That Enhance ERK MAPK Inhibitor Cytotoxicity.
(A) Cell lines were treated with a 525-inhibitor library with or without RAFi (2 μM, 72 h). Cell death was measured by CellTox Green. Drug sensitivity score (δDSS) was used to quantify inhibitor responses and plotted as red (>additive), blue (<additive) or white (no effect).
(B–D) Pa02C and Pa16C were treated with RAFi (0.01–2.5 μM) alone or in combination with ERKi (0.08–1.25 μM) (B), MEKi (0.25–4 nM) (C), or EGFRi (0.08–1.25 μM) (D) for 120 h. Proliferation was measured by Calcein AM cell viability assay. Representative bliss synergy score heatmap for three independent experiments is shown (left). Red, synergy; green, antagonism; white, no effect. Averaged dose response curves of three independent experiments (with three technical replicates) are shown (right). Error bars are ± SEM. Synergyavg = average bliss synergy score.

