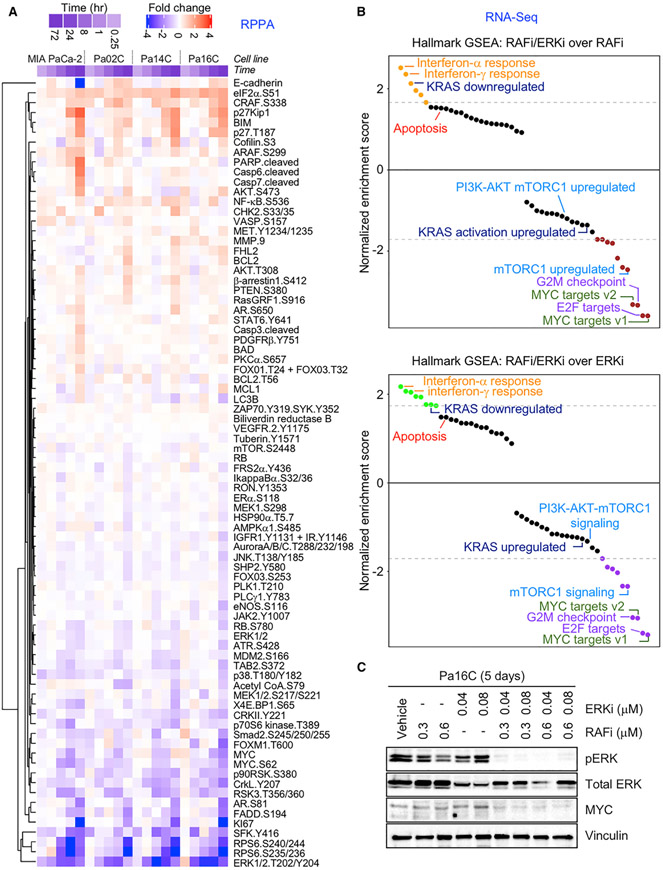
Figure 3. Concurrent RAF and ERKi Inhibition Disrupts ERK-Dependent Signaling and Cellular Processes.
(A) RPPA analyses of PDAC cell lines treated with vehicle control, RAFi (0.3 μM), ERKi (0.04 μM), or the combination for multiple time points (0.25, 1, 8, 24 and 72 h). RAFi/ERKi-treated PDAC cells were normalized to their respective vehicle control. Proteins with significant phosphorylation or expression changes at 72-h time point are plotted as fold changes. Red, increased fold change; blue, decreased fold change; white, no change.
(B) GSEA of the cell lines shown in (A). Enriched or depleted gene sets treated with RAFi/ERKi compared to RAFi (upper graph) or ERKi (below graph) are shown (24 h).
(C) Pa16C cells were treated with vehicle control, RAFi (0.3 μM) and ERKi (0.04 μM) alone, or the combination (120 h). Cell lysates were immunoblotted to determine levels of pERK, total ERK, total MYC, and vinculin. Data are representative of three independent experiments.

