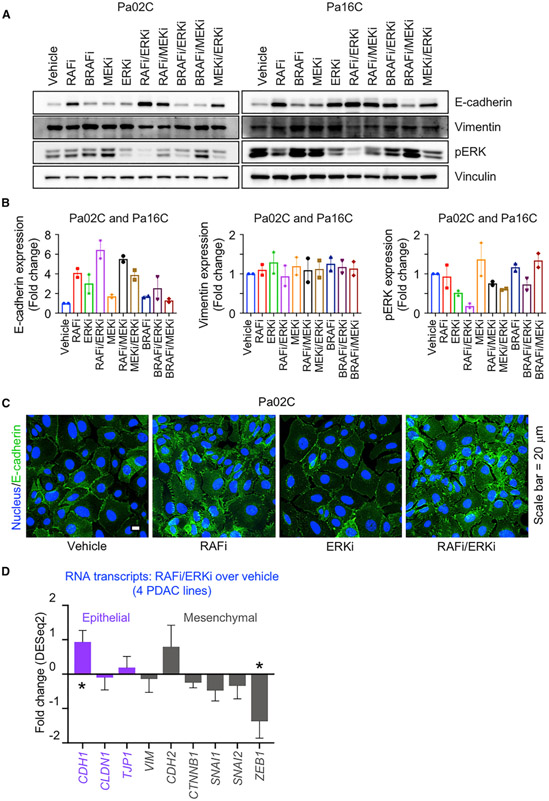
Figure 5. Concurrent RAF and ERK Inhibition Induces Mesenchymal-to-Epithelial Transition.
(A) Pa02C and Pa16C cells were treated with RAFi (0.3 μM), BRAFi (1 μM), MEKi (0.5 nM), or ERKi (0.04 μM) alone or in combination as indicated (120 h). Cell lysates were immunoblotted to determine the levels of the indicated proteins.
(B) Expression levels of the proteins in (A) are plotted as fold changes. All the proteins are normalized to loading control and their respective vehicle control. Error bars are shown as ± SEM.
(C) Representative immunofluorescence images of Pa02C cells treated with vehicle, RAFi (0.3 μM), ERKi (0.04 μM), or the combination to visualize E-cadherin expression and distribution (72 h). Scale bar, 20 μm.
(D) Fold changes in RNA expression of epithelial and mesenchymal markers are plotted for the mean average of MIA PaCa-2, Pa02C, Pa14C, and Pa16C cell lines. Error bars are shown as standard error. p values shown are from Wald test and are in comparison to the vehicle control. Adjusted p values: CDH1 (*, 0.0252), CLDN1 (0.8818), TJP1 (0.7301), VIM (0.8465), CDH2 (0.3881), CTNNB1 (0.2445), SNAI1 (0.2542), SNAI2 (0.5672), ZEB1 (*, 0.0262).

