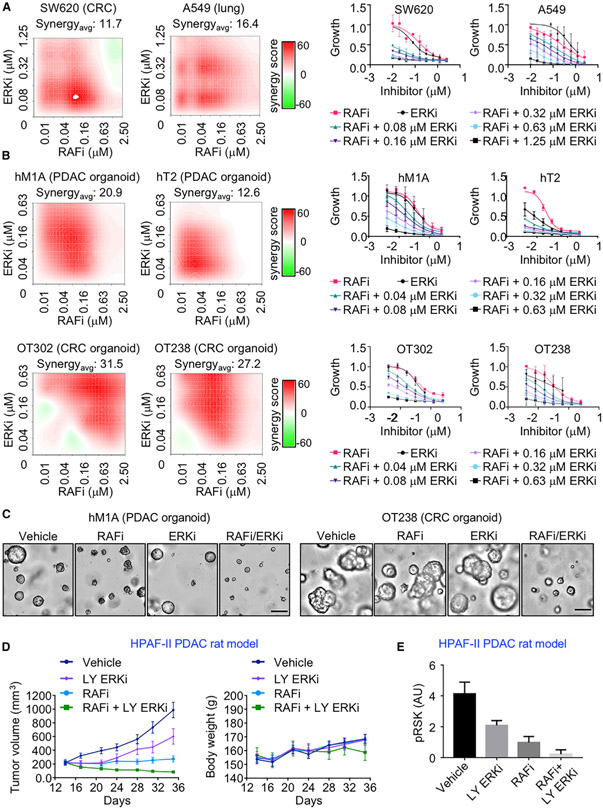
Figure 7. Vertical ERK MAPK Inhibition is Effective in Organoid and Rat Models of KRAS Mutant Cancers.
(A) KRAS mutant cancer cell lines were treated with RAFi (0.01–2.5 μM) and ERKi (0.08–1.25 μM) alone or in combination for 120 h. Proliferation was measured by Calcein AM cell viability assay. Representative bliss synergy score heatmaps for three independent experiments is shown (left). Red, synergy; green, antagonism; white, no effect. The averaged dose response curves of three independent experiments are shown (right). Error bars are ± SEM. Synergyavg = average bliss synergy score.
(B) KRAS mutant PDAC (10 days) and CRC organoids (5 days) were treated with RAFi (0.01–2.5 μM) and ERKi (0.04–0.63 μM) alone or in combination. Proliferation was measured by CellTiter-Glo 3D cell viability assay. Dose response curves and bliss synergy scores were calculated and represented as in (A).
(C) Representative images of PDAC organoid hM1A treated with the vehicle control DMSO or RAFi (0.16 μM) or ERKi (0.04 μM) alone or in combination (left). Scale bar, 200 μm. Representative images of CRC organoid OT238 treated with DMSO or RAFi (0.31 μM) or ERKi (0.04 μM) alone or in combination (right). Scale bar, 100 μm.
(D) Relative tumor volume of the NIH nude rats with implanted HPAF-II cells were treated with RAFi (20 mpk, BID) alone or in combination with the ERKi LY3214996 (LY ERKi, 10 mpk, QD) for 36 days (left). Body weight changes are shown (right). Error bars are shown as ± SEM.
(E) Quantitation of blot analysis to determine levels of pRSK of tumor lysates (n = 5 animals per group). Error bars are shown as ± SEM.

