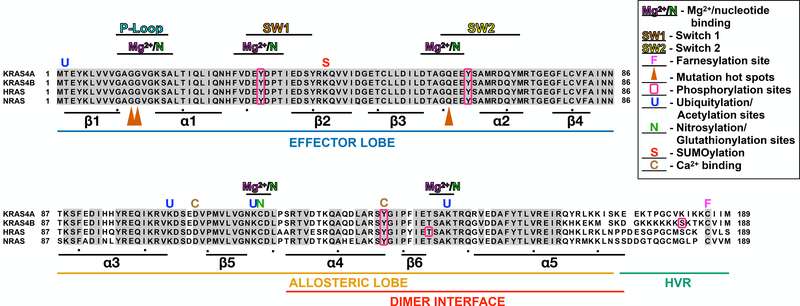
Figure 1. RAS structure.
Alignment of RAS isoforms. Secondary structure is indicated by the location of alpha helices and beta strands. PTMs to specific residues are indicated as follows: farnesylation, (F); ubiquitylation and acetylation, (U); nitrosylation and glutationylation, (N); SUMOylation, (S); and Ca2+ binding, (C); phosphorylation, boxed residues (O); mutation hotspots,orange arrowheads (▲). Additionally, the dimer interface (α4-β6-α5) in highlighted.

