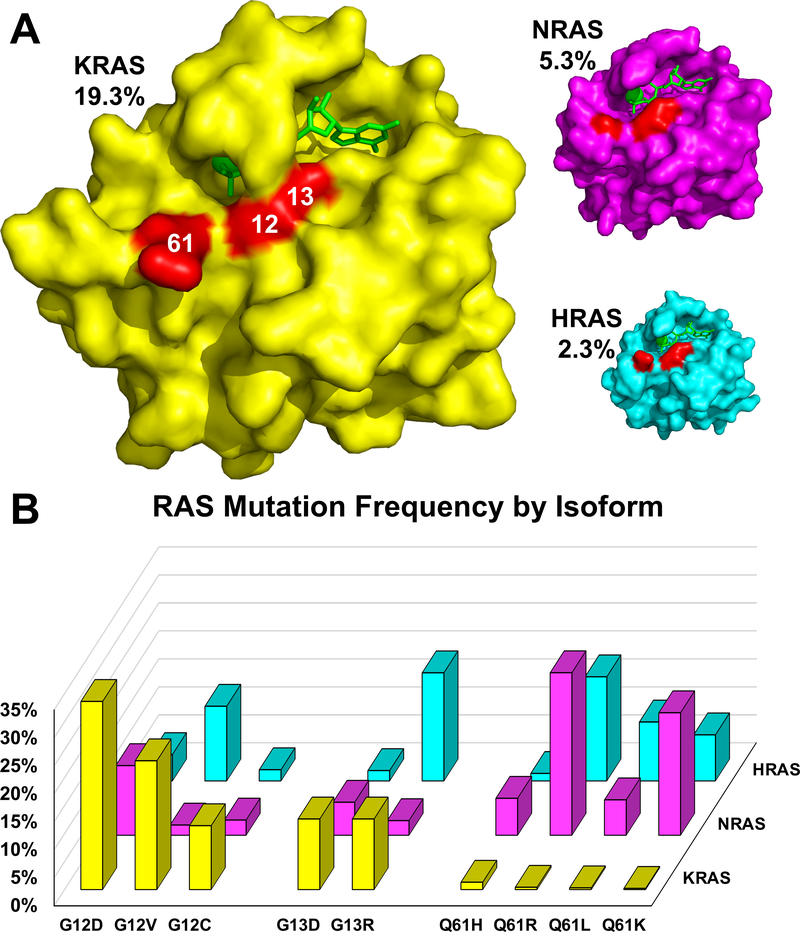
Figure 5. RAS mutation frequency.
(A) Structures of wild-type KRAS (PDB:6GOD; yellow), NRAS (PDB:5UHV; magenta), and HRAS (PDB:5P21; cyan) loaded with GppNHp were aligned and sized relative to their mutation frequency in cancer (indicated as percentages). Mutation hotspots are indicated in red and labeled with codon number. (B) The frequency of specific missense mutations is graphed as the percentage of occurrences relative to the total number of mutations within each isoform. Data were compiled from the Catalogue of Somatic Mutations (COSMIC), v86 (Forbes et al., 2017).

