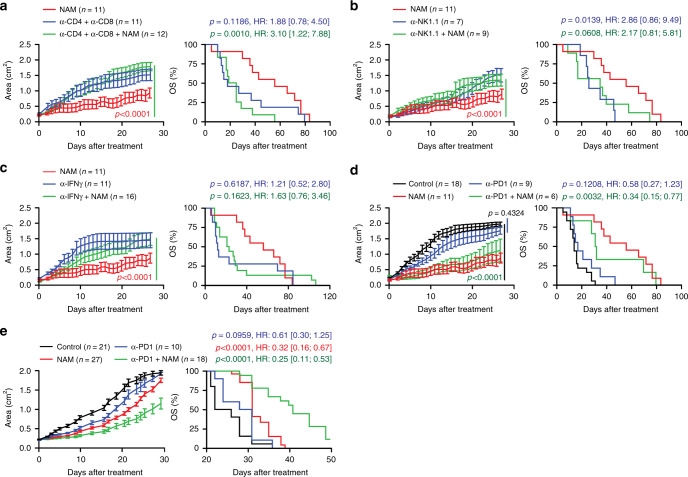
Fig. 7. The therapeutic effects of NAM depend on T cells and immune signaling.
a–c Tumor growth and overall survival (OS) in C57BL/6 mice bearing established M/D-driven tumors that were maintained in control conditions (a–c) or subjected to NAM supplementation with the drinking water alone (a–c), or in the context of CD4+ and CD8+ T cell co-depletion (a), NK cell depletion (b), or IFNG neutralization (c). Tumor growth results are means ± SEM. Number of mice, hazard ratio (HR) and p values (two-way ANOVA corrected for row (time) and column (treatment) factors for tumor growth and two-sided log-rank for OS). Please note that NAM-treated tumors (red curves) in (a–c) are from the same experiment, also depicted in (d). d, e Tumor growth and OS in C57BL/6 (d) or BALB/c (e) mice bearing established M/D-driven (d) or TSA (e) tumors that were maintained in control conditions or subjected to NAM supplementation with the drinking water or systemic PD-1 blockage, alone or in combination. Tumor growth results are means ± SEM. Number of mice, hazard ratio (HR) and p values (two-way ANOVA corrected for row (time) and column (treatment) factors for tumor growth and two-sided log-rank for OS). Please note that NAM-treated tumors (red curves) in (d) are from the same experiment depicted in (a–c).

