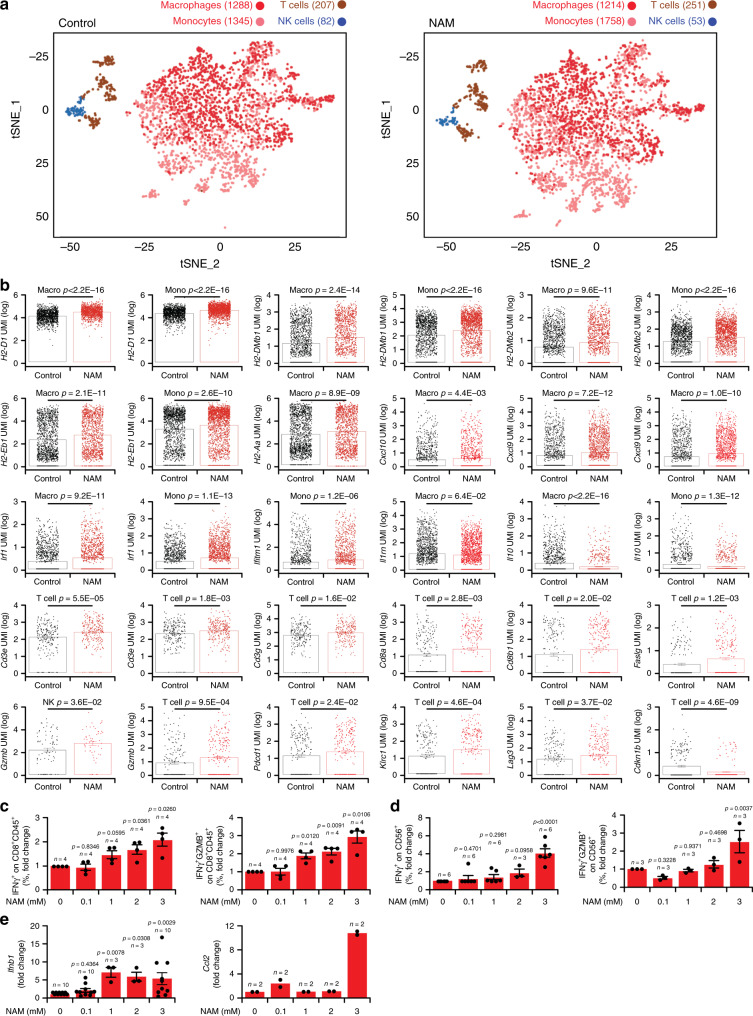
Fig. 8. NAM-treated tumors exhibit improved antigen presentation and superior cytotoxic functions.
a tSNE plots of untreated and NAM-treated TSA tumors. Number of cells in each of the main four populations is reported. b Differential expression of genes involved in immune regulation in CD45+ cells isolated from untreated vs NAM-treated TSA tumors. Results are mean ± SEM plus individual data points. Number of cells independently analyzed for each gene is reported in (a), p values (two-sided Wilcoxon test) are indicated. See also Supplementary Data 1. c, d Percentage of IFNG+ and IFNG+GZMB+ amongst CD8+ T cells (c) and CD56+ NK cells (d) from peripheral blood mononuclear cells (PBMCs) of healthy donors subjected to non-specific activation overnight in the presence of the indicated concentrations of NAM. Results are means ± SEM plus individual data points. Number of biologically independent samples and p values (one way-ANOVA plus Fisher LSD, as compared to untreated cells) are reported. e Relative expression levels of Ifnb1 and Ccl2 in TSA cells cultured in control conditions or exposed to the indicated concentrations of NAM for 48 h. Results are means ± SEM plus individual data points. Number of biologically independent samples and p values (one way-ANOVA plus Fisher LSD, as compared to untreated cells) are reported.

