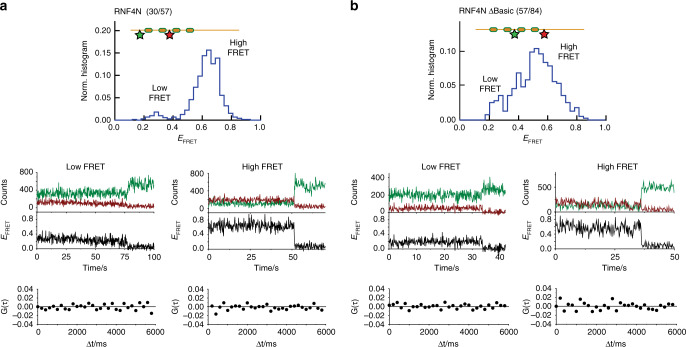
Fig. 3. Cross-correlation analysis of RNF4N smFRET peptides.
a Single-molecule FRET histogram obtained for RNF4N 30/57 (top panel), representative low- and high-FRET trajectories (middle panel) and cross-correlation curves (bottom panels) obtained for the traces shown in the middle panels. b Single-molecule FRET histogram obtained for RNF4N ΔBasic 57/84 (top panel), representative low- and high-FRET trajectories (middle panel) and corresponding cross-correlation curves (bottom panel). Histogram in A from Fig. 2b, histogram in B from Supplementary Fig. 17. Source data are provided as a Source Data file.

