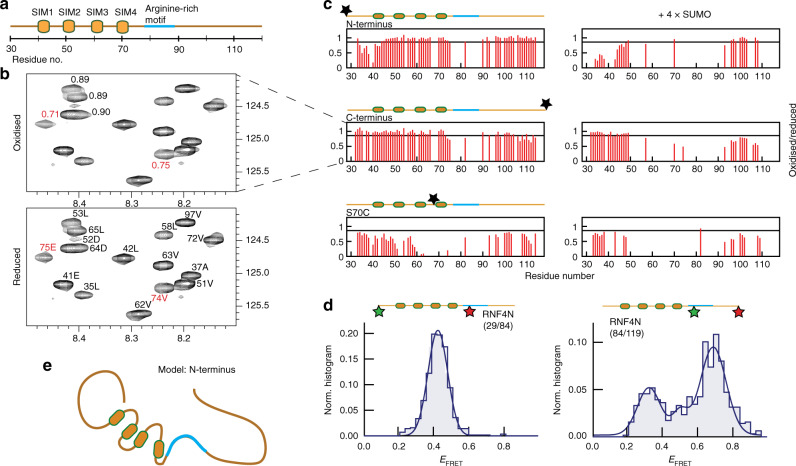
Fig. 4. NMR and smFRET reveal compact shape of entire RNF4N-terminus.
a RNF4N peptide layout used in B and C. b 1H–15N HSQC spectrum of RNF4N labelled at the C-terminus with an MTSL spin label (top). Reference 1H-15N HSQC spectrum of reduced RNF4N using peak assignment established previously12 (bottom). Peaks with significant ratio changes adjacent to the arginine-rich motif, 74E and 75 V (red), indicated. c Histograms of HSQC peak intensity ratios plotted for RNF4N labelled at the termini and S70C (left) and in complex with SUMO chains (right). Peaks are absent due to severe peak broadening in the SUMO complex. Significant intensity reductions are below 0.85 (black line) (corresponding 1H–15N HSQC spectra, Supplementary Figs. 11–13). d Single-molecule FRET histograms obtained from RNF4N peptides labelled with donor/acceptor FRET dyes at the N-terminus and basic region (left) or C-terminus and basic region (right) (labelled residue numbers inset). Single-molecule histograms were built from more than 400 molecules. e Model of RNF4N displaying both termini folding towards the centre of the peptide, and with the basic arginine-rich motif adjacent to the SIMs highlighted (blue). Source data are provided as a Source Data file.

