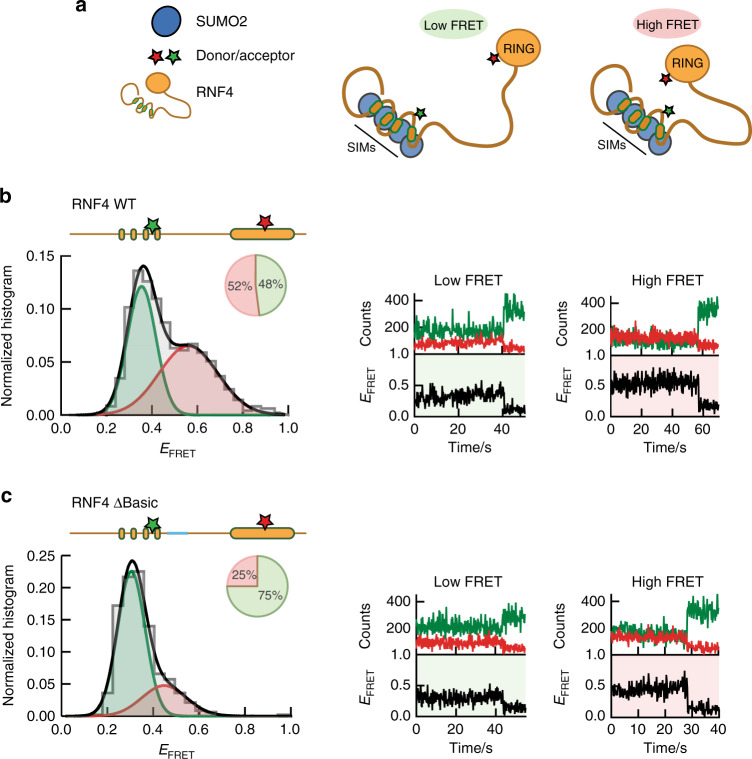
Fig. 6. Single-molecule analysis of full-length RNF4 confirms compact shape.
a Model of full-length RNF4 displaying potential low-FRET and high-FRET states. b Single-molecule FRET histograms obtained from full-length RNF4 WT, labelled with donor/acceptor FRET dyes at SIMs and RING domain (residues 70,144; illustrated inset) (left). Pie charts indicate the percentage of molecules in a low-FRET (green) or high-FRET (red) state. Representative single-molecule trajectories obtained for RNF4 WT (right). c As in b but analysis performed on RNF4 ∆Basic. Single-molecule histograms were built from more than 500 molecules. Source data are provided as a Source Data file.

