Figure 7.
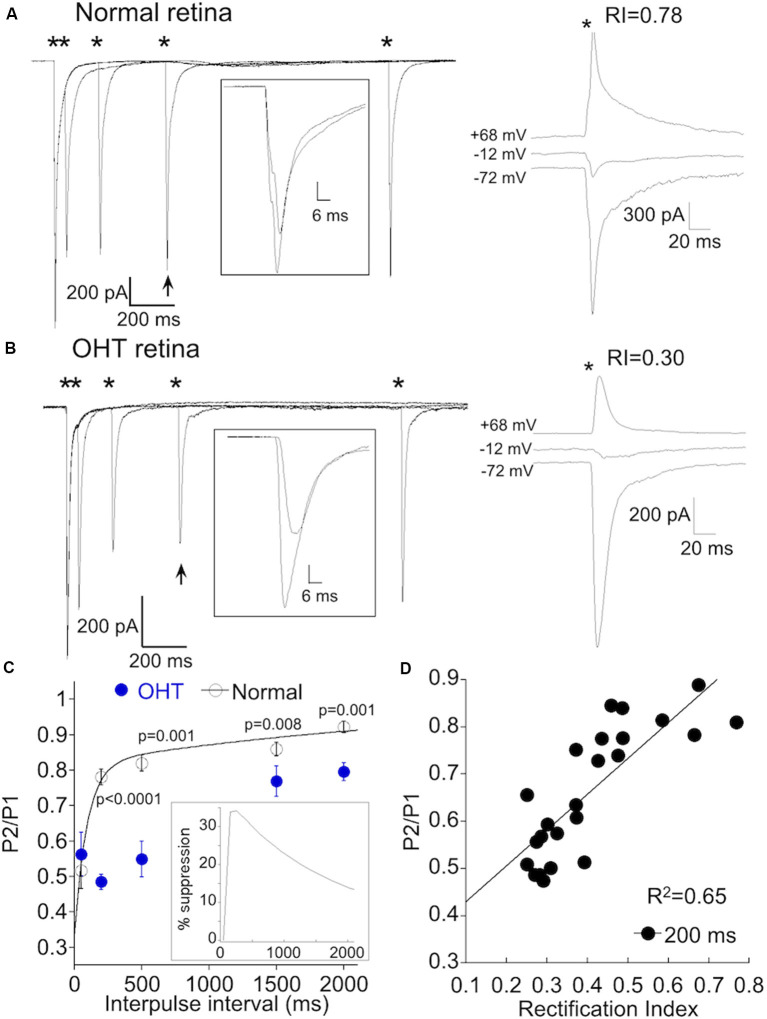
AMPAR remodeling is associated with delayed short-term synaptic depression. (A) Left, responses of an α On RGCs from a retina with normal IOP to paired 1 ms, 8.0 mW ChR2 stimulation at intervals indicated by the asterisks. Inset: overlay of the first response with the response obtained 500 ms later (indicated by arrow). The recovery of the EPSC is nearly complete after 500 ms. Right, IV relation of the same cell shows only a small amount of rectification, indicating low CP-AMPAR expression. (B) As in (A), but the α On RGC was from an OHT retina. Rectification at positive voltage is pronounced in this cell. Inset shows a reduced recovery of the EPSC at this time point. (C) Summary of paired-pulse depression (PPD) at the indicated pulse intervals of α RGCs from OHT (n = 17) and normal retinas (n = 14). The sum of two exponentials, Afast*exp(-t/tfast) and Aslow*exp(-t/tslow), was used to fit the recovery of the EPSC for α RGCs from retinas with normal IOP. The fits were extrapolated to 15 s following the first stimulus, which represented a full recovery of the EPSC. Inset: time course of the delayed suppression of the EPSC obtained from the difference of the mean fits the normal and OHT conditions. (D) Correlation of rectification index with the paired-pulse ratio (PPR) at 200 ms. The delayed PPR was highly correlated with CP-AMPAR expression (p = 2.0 × 10⁻⁶).

