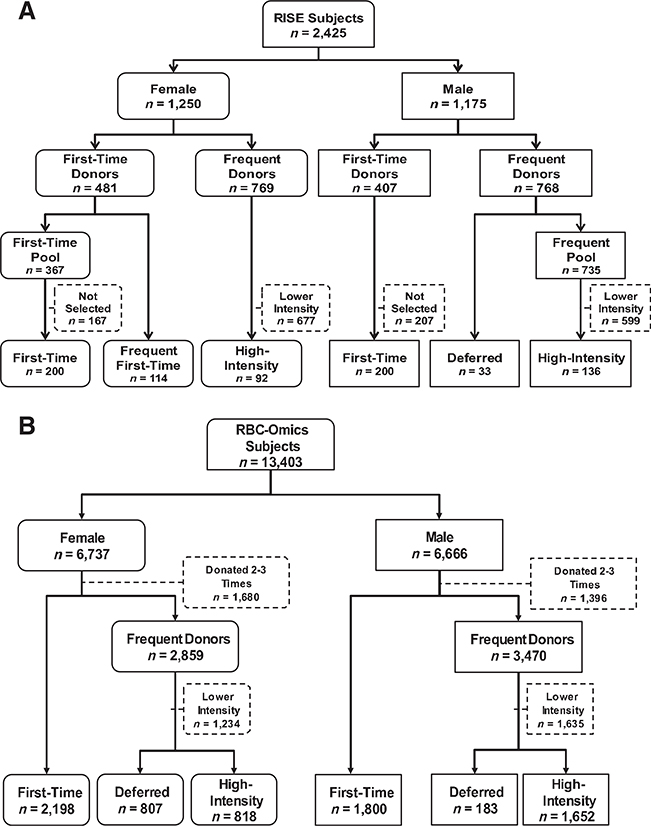
Fig. 1.
Flow diagrams depicting selection of blood donors for participation in the study and segregation into analysis groups.
(A) Participants in the longitudinal study were selected from 2425 subjects enrolled in RISE. The flow diagram outlines the numbers of male and female subjects in RISE, the numbers of first-time/reactivated donors and the numbers of frequent donors, and how they were sorted into the final six analysis groups. (B) Participants in the cross-sectional study were selected from 13,403 subjects enrolled in RBC- Omics. The flow diagram outlines the numbers of male and female subjects in RBC-Omics, the numbers of first-time/reactivated donors and the numbers of frequent donors, and how they were sorted into the final six analysis groups.

