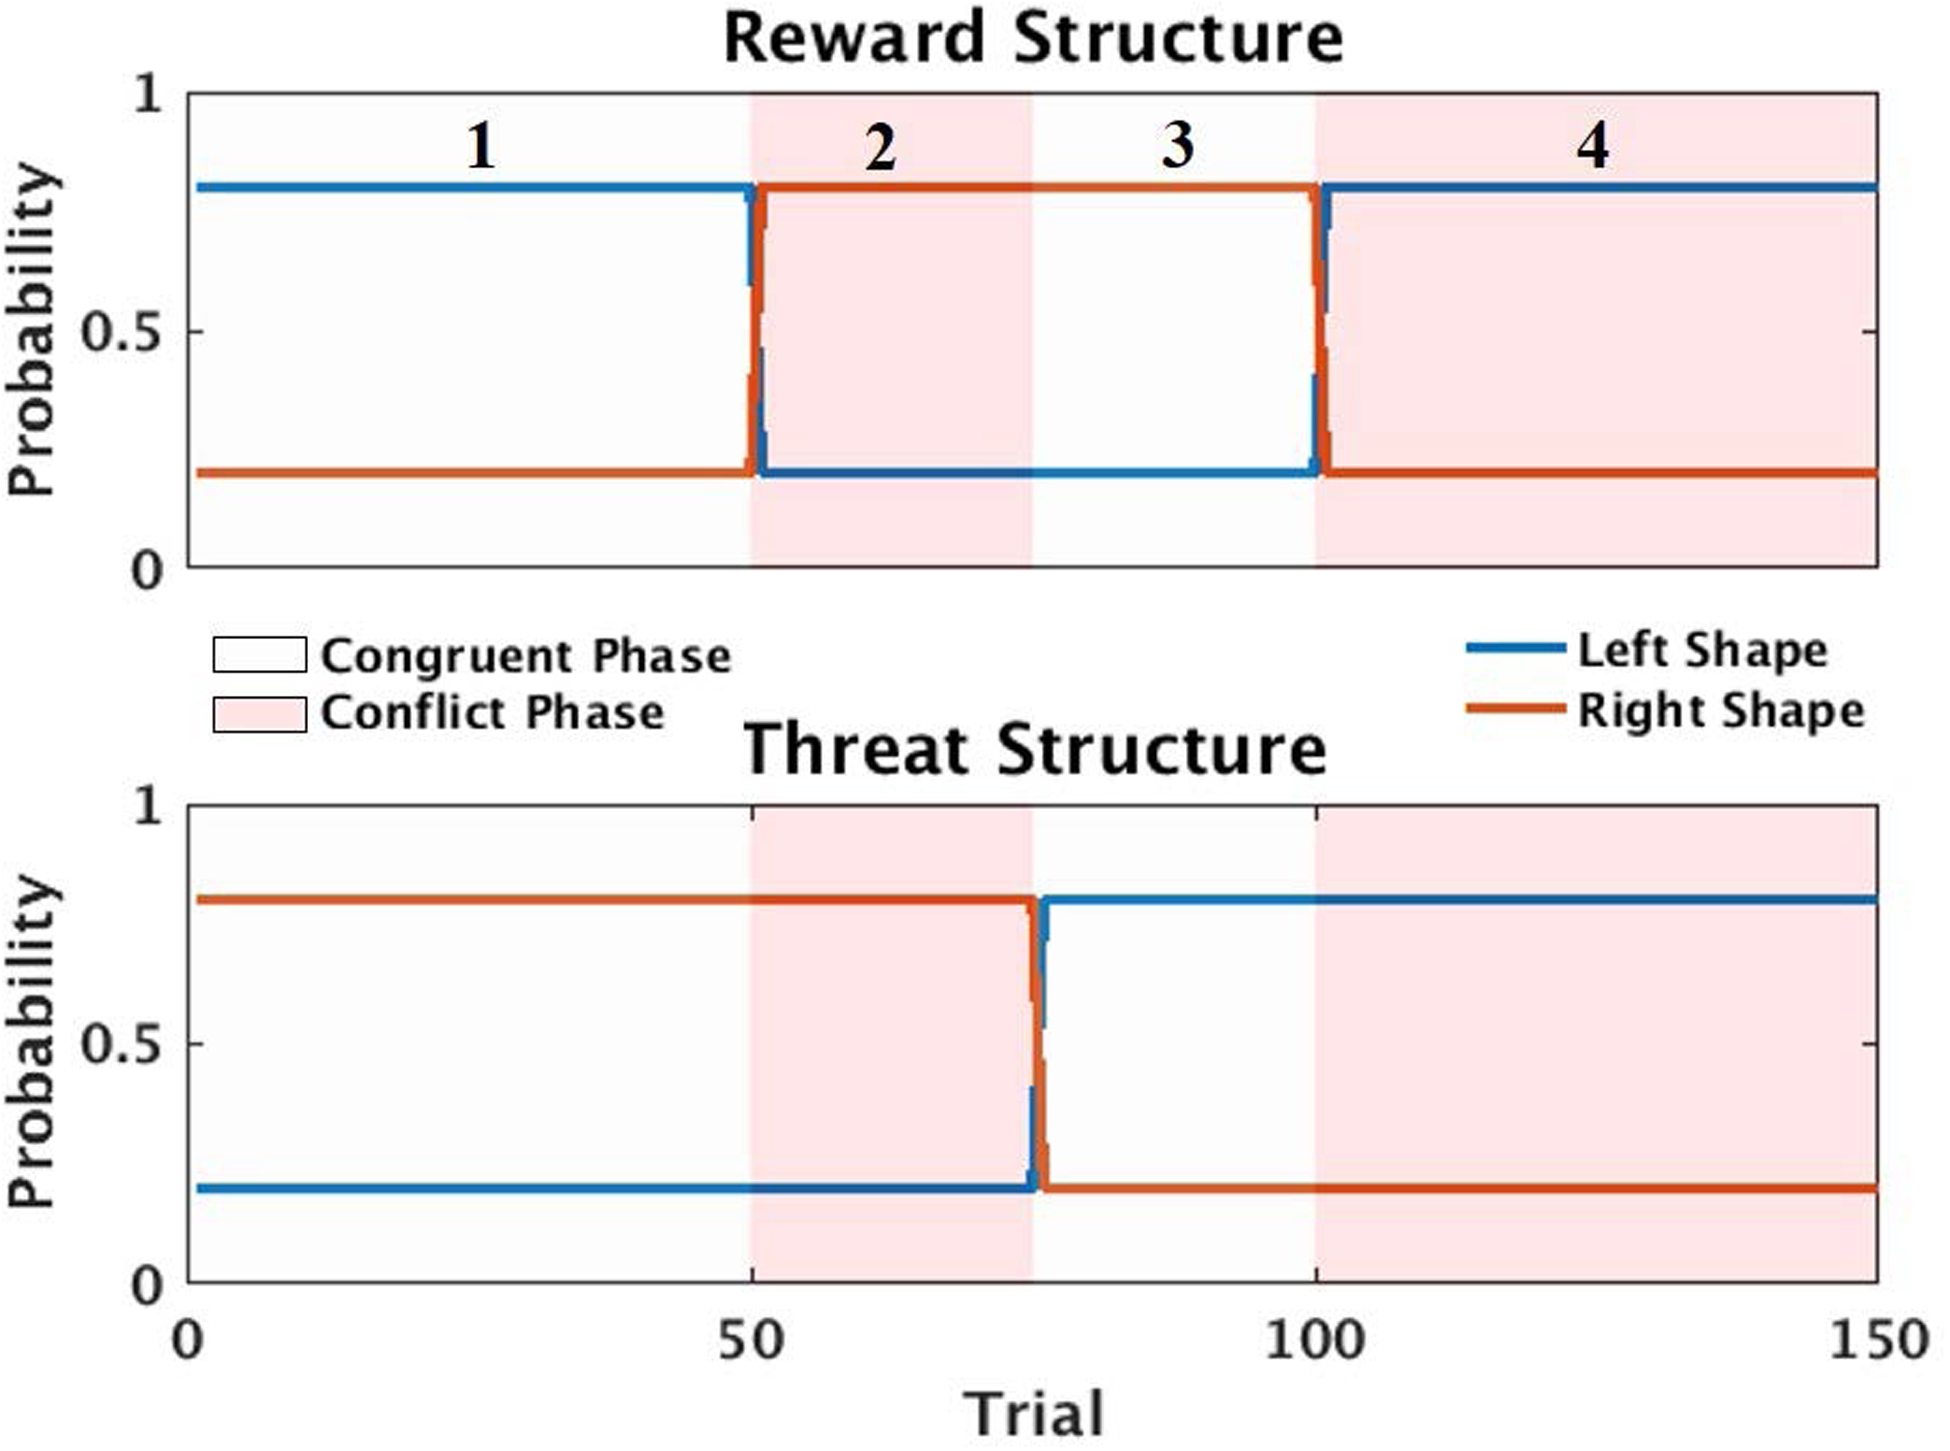
Figure 3.

Reward structure of the trAAC task in Study 1. Reward structure shows the probability of reward outcomes (winning or losing points) for two of the three shapes across all trials. The Left and Right Shapes correspond to options seen in Figure 1. Probability of threat and reward outcomes remained at .5 throughout the entire task for the Middle Shape, therefore is not plotted. Threat structure shows the probability of a shape presenting a threat image. The alternation of reward and threat outcome probabilities created the Conflict and Congruent Phase manipulations; Conflict and Congruent phases are depicted in red and white. Therefore, when reward/threat structure = .8, there is an 80% chance of winning a number of points/seeing a threat image, and when probability = .2, there is a 20% chance of winning points/seeing a threat image. Blocks are numbered one through four in the Reward Structure pane, and correspond to the numbered Blocks in Figure 2.
