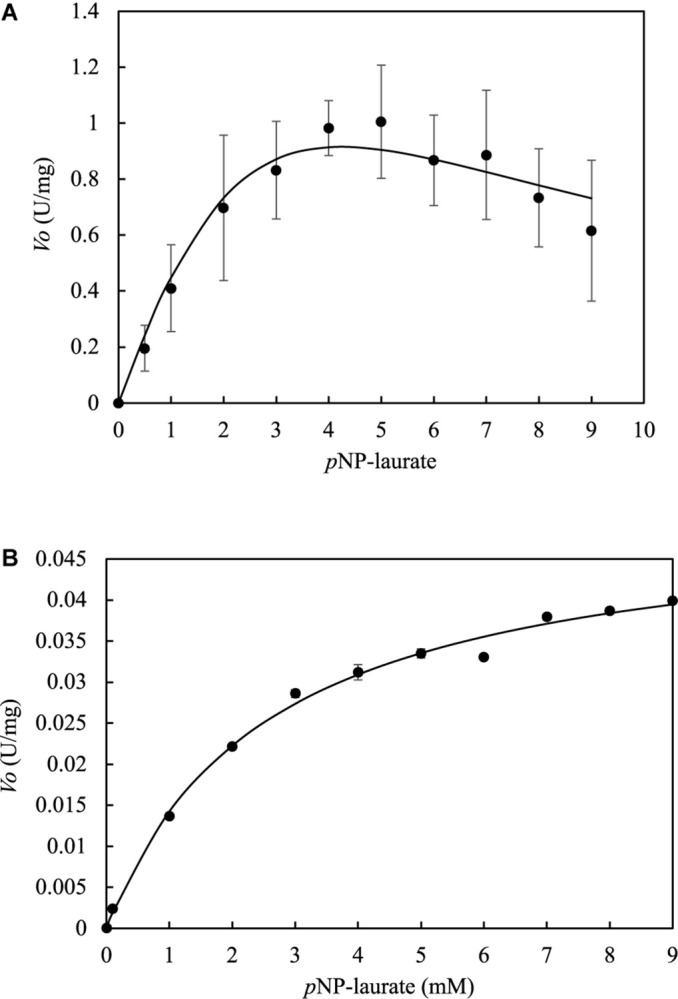
FIGURE 7.

Determination of kinetic constants at pH 7 and 37°C for LrLyp and BlLyp by no-linear regression. Error bars represent the standard deviation. LrLyp (A) shows substrate inhibition kinetics, while BlLyp (B) shows a typical Michaelis Menten kinetics. Error bars denote plus/minus one standard deviation.
